Equity Risk Premium Part 2: Where is S&P 500 headed next?
Building a framework to determine S&P 500 price target for US economic scenarios based on expected implied equity risk premium, earnings growth, inflation and 10Y bond rate.
At a Glance
At the end of every quarter, investment banks and research firms present their S&P 500 price target for the fiscal year. Today, the price target ranges from 3900 to 4900. In other words, if I were to invest in the S&P 500 today, I have a 50:50 chance of a profit vs. a loss. Why in my right mind would I then choose to invest?
To answer the question, I dive into the Implied Equity Risk Premium a.k.a implied ERP. I show how to use the implied ERP method to dive into the investor mindset & determine the S&P 500 price target given Earnings growth and Inflation Expectation.
Remember: Equity Risk Premium = Expected rate of return on S&P 500 - 10Y Bond rate
Based on my assumptions, Implied Equity Risk Premium of the S&P 500 (as of Sep 11, 2023) stands at 4.68% when 10Y Treasury bond yield is at 4.3%. This implies that the Expected rate of return for S&P 500 stands at 8.98%
My framework suggests that the S&P 500 will possibly create new highs over 4800+ in FY 2023 assuming earnings beats expectations by +5% and inflation expectations remain anchored. But caveats remain nonetheless.
Read below to find out the S&P 500 target for every possible economic scenario that may play out for the US economy next.
1. Let’s frame the problem
At the end of every quarter, investment banks and research firms present their S&P 500 price target for the fiscal year.
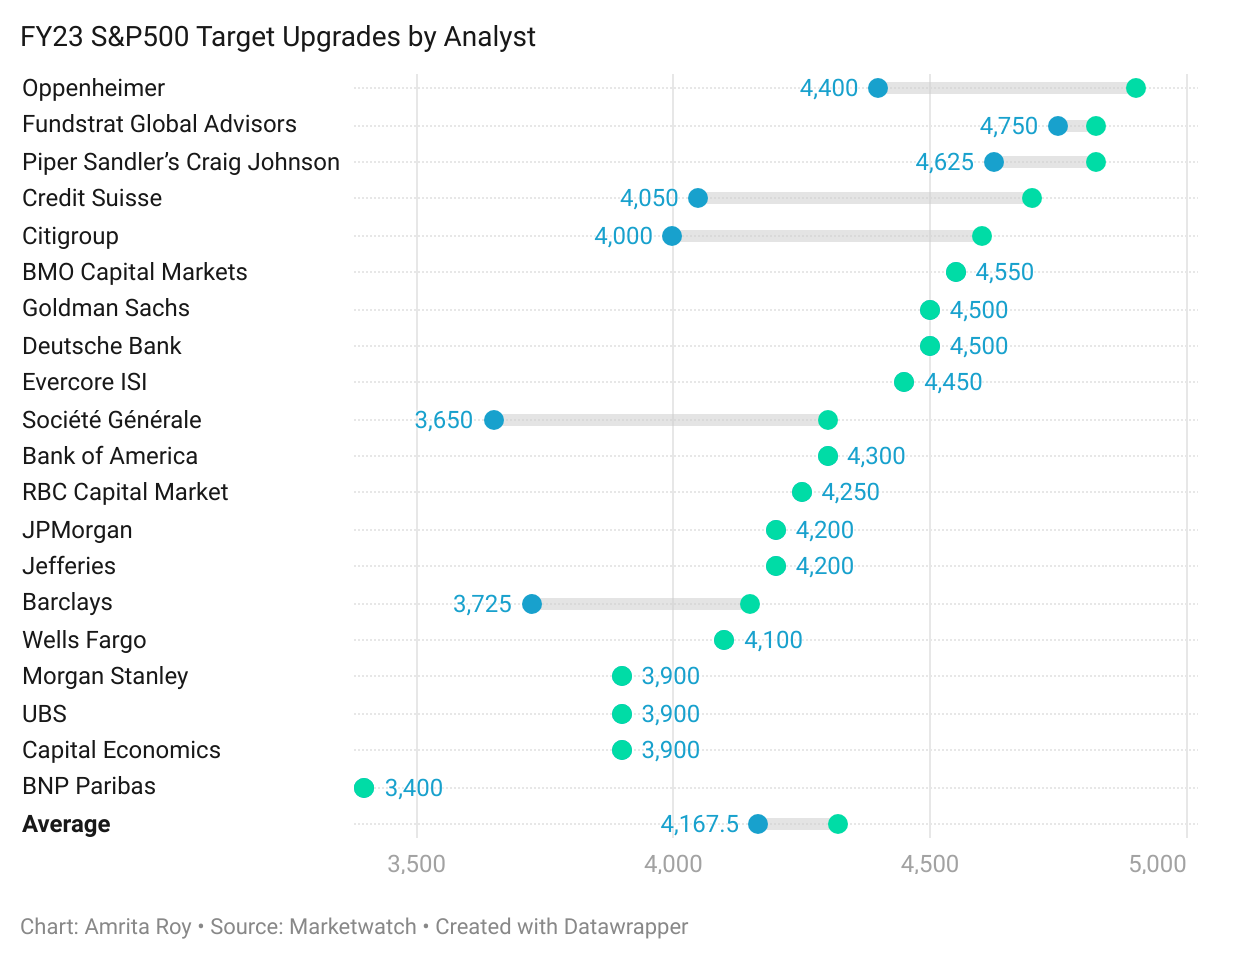
As of August 1, 2023, Marketwatch has collated the following price targets by major investment banks below:
What can I make of the chart above?
S&P 500 can range anywhere between 3900 to 4900 by the end of FY 2023, a difference of 25% points between the two points.
Therefore, if I were to invest in S&P500 at the close of Sep 11 at 4487, I would either make a max profit of 10% or a max loss of 12% by the end of FY 2023.
That's a 50:50 probability of profit vs. loss.
So, why in my right mind would I want to invest in the S&P 500 given it has the nearly same probability of a gain to that of a loss same as to tossing a coin.
2. Enter Equity Risk Premium
A quick recap
In the last post, I established that the Equity Risk Premium is the additional premium an investor demands on top of a risk-free rate to invest in equities. You can read Part 1 below:
I had also demonstrated how to calculate the Equity Risk Premium of S&P 500 based on the difference of Earnings yield and 10 Y bond yields.
I had pointed out that the Equity Risk Premium of S&P 500 was at the lowest level since 2009 at 0.7%
Today, we will explore how to calculate the Implied Equity Risk Premium of the S&P 500.
3. Let’s dive right in!!!
The Implied Equity Risk Premium is a fundamental approach to estimating the expected rate of return on equities (in this case, the S&P 500), based on current price, expected future cash flows and 10Y bond rate.
I give credit to Aswath Damodaran for the following exercise on computing the Implied Equity Risk Premium of S&P 500.

At the time of this post, following are my key assumptions to determine the Implied Equity Risk Premium:
S&P 500 Expected Earnings for FY 2023 is estimated to grow at 0.53% YoY to $220.17
S&P500 Expected Earnings for FY 2024 is estimated to grow at 11.91% YoY to $246.40
Between 2025-2027, S&P500 Expected Earnings is estimated to grow at 6.5% (slightly lower than 10 year average of earnings growth of 8.5% annually)
After 2027, Expected Earnings for S&P 500 grow at 3.5% on a YoY basis forever. This is equal to my estimate of the long-term 10Y Treasury bond yield.
Expected cash payout (Dividends + Buybacks) is estimated at 82% of S&P 500 Expected Earnings.
Given S&P 500 =4487 (Sep 11, 2023), I calculated the Expected rate of return for S&P 500 using the following equation:
Solving for r (Expected rate of return of S&P 500) = 8.98%
Equity Risk Premium = Expected rate of return on S&P 500 - 10Y Bond rate
Therefore, the Implied Equity Risk Premium (per my assumptions) = 4.68%
4. What does an Implied Equity Risk Premium of 4.68% tell me?
An Implied Equity Risk Premium of 4.68% means that given where S&P 500 is currently trading on Sep 11 2023, investors are rewarded an additional premium of 4.68% on top of the the risk-free rate (10Y Treasury bond = 4.3% on Sep 11, 2023) to invest in equities.
Is that number too high? Too low? What do I make of it?
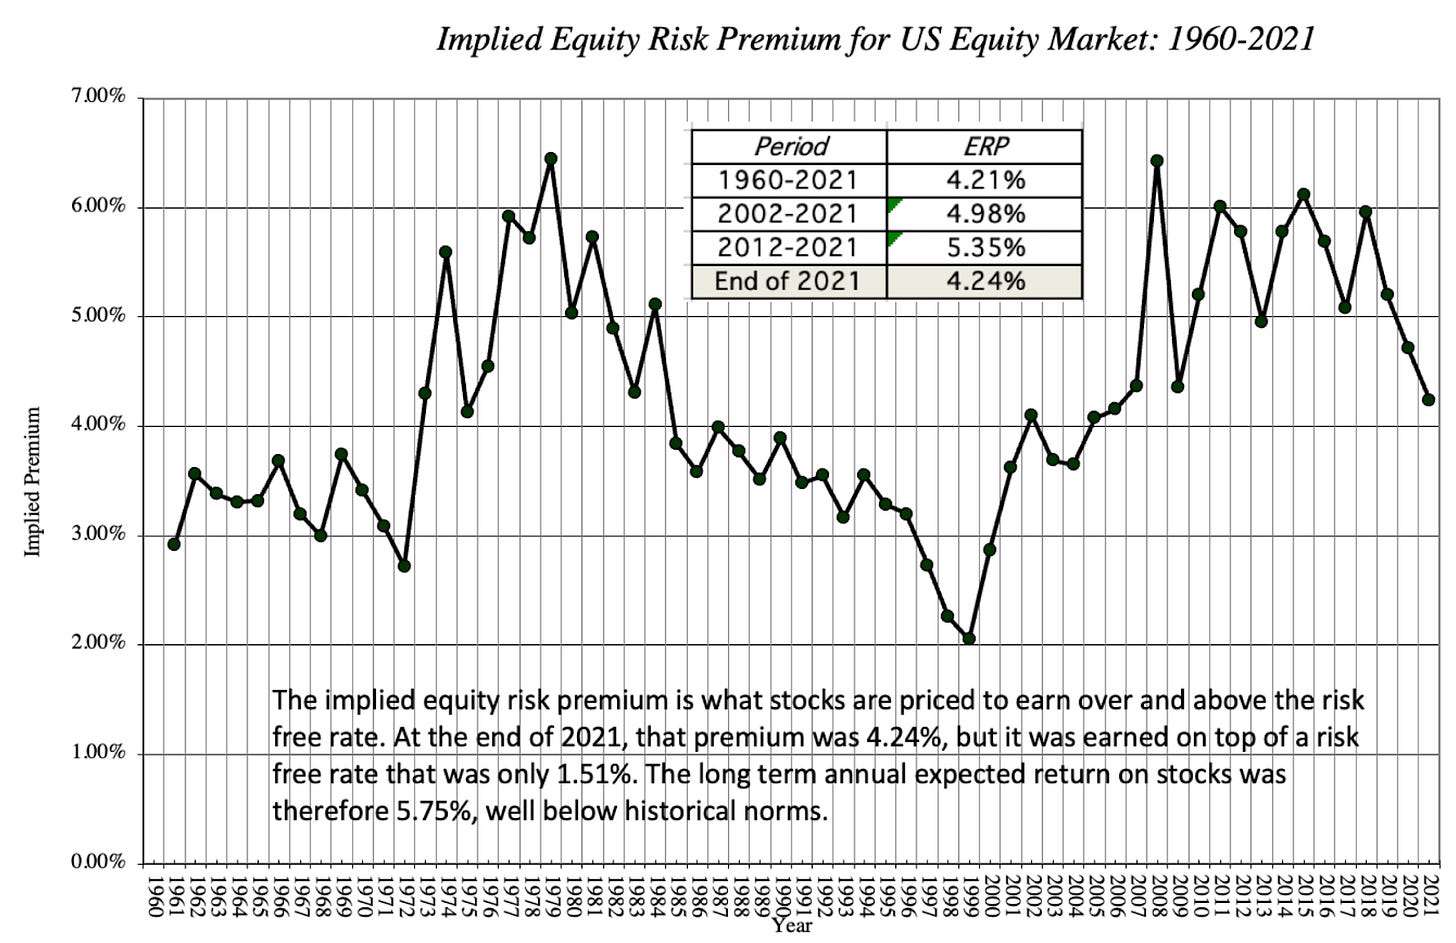
The following chart illustrates the Implied Equity Risk of S&P 500 from 1960-2021.
(If you want data on historical Implied Equity Risk Premium, Aswath Damodaran has a spreadsheet where you can access all the data.)
Key Observations
We can see that an Implied Equity Risk Premium of 4.68% is lower than the average of the period between 2002-2021 and 2012-2021.
During the dot-com era, the implied equity risk premium had dropped to an all time low of 2.00%
During the Volcker era and the peak of the GFC crisis, the implied equity risk premium reached a high of 6.5%
5. So, where is S&P 500 headed next?
So far, we have established the following:
Current Implied Equity Risk Premium = 4.68%, when 10Y Treasury bond = 4.3%.
The value of the current implied equity risk premium is neither too high or too low.
Where S&P 500 heads next will be determined by the future implied equity risk premium which will be based on
Actual vs. Expected Earnings growth
Actual vs. Expected Inflation (which will be reflected in the 10Y Treasury bond yield)
Overall Economic (un)certainty
Therefore, based on the information, I built the S&P 500 price target framework below, where I computed the S&P 500 price target based on expected implied equity risk premium. The expected implied equity risk premium will range between 4.50-6% based on Earnings growth and Inflation expectation.

When I then overlay the S&P 500 price target framework onto the Economic Scenario Map, I have achieved the possible price targets for the S&P 500 for key economic scenarios for the US.
This is how you read the tables:
If Inflation remains at current levels and Earnings come at expectation, Implied ERP = 4.5-5%. S&P 500 will range between 4400-4600. This is the Status Quo economic scenario.
If Inflation rises from current levels with 10Y Treasury bond pushing close to 5% and Earnings come at expectation, Implied ERP = 5.5%. S&P 500 will range between 3700-4000. This is the Higher for longer scenario.
If Inflation stays at current levels and earnings come 5% better than expectation, Implied ERP= 4.5%. In that case, S&P 500 will reach 2021 highs.
If Inflation drops from current levels with 10Y Treasury bond close to 3% and earnings come 5% better than expectation, Implied ERP= 4.5% or lower. In that case, S&P 500 will create new highs at 5000+ level. This is the Productivity Acceleration scenario.
If Inflation remains at current levels or higher and Earnings come 5% below expectation, Implied ERP = 5.5%-6%. In that case, S&P 500 will likely test October lows of 3400 and below. This is the Stagflation scenario.
If Inflation remains at current levels or higher and Earnings come 15% below expectation, Implied ERP = 6%. In that case, S&P 500 will be in deep bear market territory at 2900 levels and below. This is the Hyperinflationary Recession scenario.
If Inflation drops from current levels or higher and Earnings come 5-15% below expectation, Implied ERP = 5.5-6%. In that case, S&P 500 will range between 3000-3400. This is the Deflationary Recession scenario.
That’s all for today, folks!!
If you enjoyed today’s framework of how to determine S&P 500 target given the path of inflation and earnings growth, please spread the love by sharing it in your network and helping The Pragmatic Optimist grow.
Amrita


IDK, but I've said, as have others, we are in uncharted waters… And that inverted yield curve remains firmly entrenched and as long as we have this phenomenon glaring us straight in the face, take your winnings while the winning is good. Short-term notes @5.25 remain. Grab them sleep soundly.