Friday5: US still on track for soft-landing with 27 states in contraction? Dividend ETFs underperformed S&P 500 & more...
Plus 5 charts to illustrate the cost-of-living squeeze, the average down payment across homebuyer segments & the annual salary that would buy happiness for all.
««Friday5- At a Glance»»
❓The S&P 500 climbed 9% in November as “soft landing” takes hold of market narrative. Meanwhile, 27 states experienced economic contraction.
😰5 charts that show how bad the cost-of-living squeeze is for the average American today.
🏡The typical down-payment for a first time home buyer is at its highest level since 1997. They are paying it using savings, gifts and financial assets.
🤑 Can money buy happiness? Sure it can. Millennials believe $525K in annual salary to be precise.
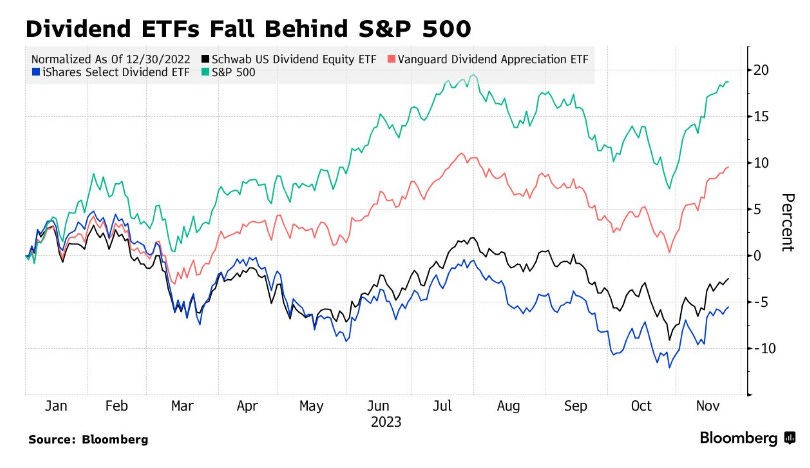
📉If your investment portfolio contains primarily dividend ETFs, I am sorry to tell you that you have underperformed the S&P 500.
❓The S&P 500 climbed 9% in November as “soft landing” takes hold of market narrative. Meanwhile, 27 states experienced economic contraction.
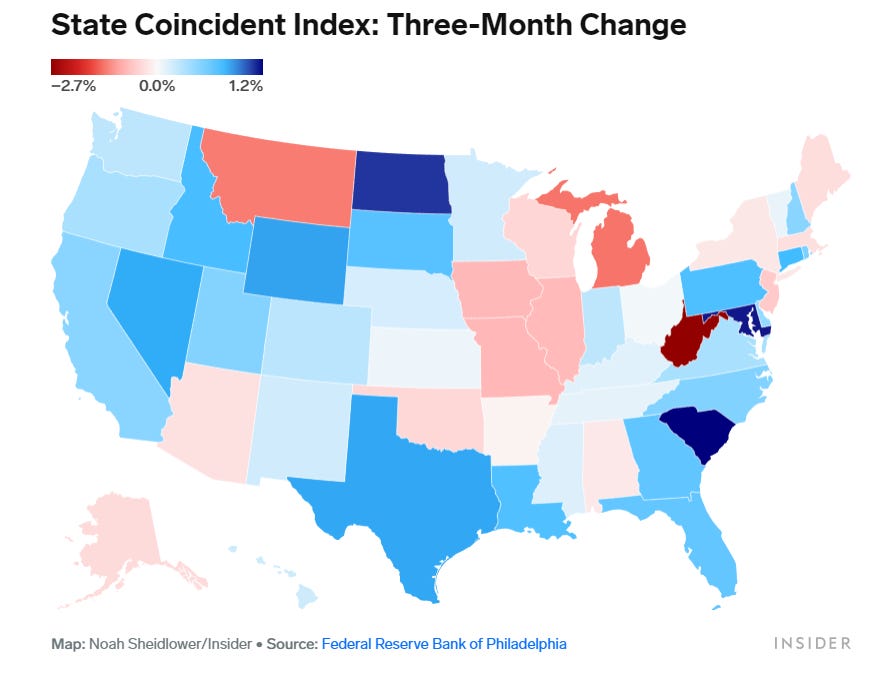
While the S&P 500 climbed 9% in November as bond yields and oil prices declined, reigniting the “soft landing” narrative once again, the economies of 16 US states contracted between July and October.
The latest State Coincident Indexes release from the Federal Reserve Bank of Philadelphia shows a third of state economies contracted during the three-month period, compared to just nine states between June and September. Looking at month-over-month rates, 27 states experienced economic contraction, while 16 states saw economic growth.
These changes were most pronounced in West Virginia, with a three-month contraction of over (2.7)%. Michigan and Montana also had contractions of over (1)%, while Missouri, Illinois, and Iowa had declines of about (0.8)%.
Among the 10 states with the highest GDPs, California, Texas, Florida, Pennsylvania, Ohio, Georgia, and North Carolina are growing their economies, according to the three-month data.
“This growth should be enough to keep the US economy as a whole from falling into recession this quarter," DataTrek Research cofounders Nicholas Colas and Jessica Rabe said in a note on Monday. "How these trends develop through the balance of Q4 will tell us a lot about the state of the US economy as we enter 2024."
The coincident indexes pull together four state-level indicators, including nonfarm payroll employment, the unemployment rate, average hours worked in manufacturing by production workers, and wage and salary disbursements deflated by the consumer price index.
Experts remain divided on whether the US will avoid a recession in 2024. Some believe a recession is likely in 2024, including Citadel founder Ken Griffin. Others think a recession may not arrive until 2025, or may not occur at all. Raphael Bostic, the president of the Atlanta Federal Reserve, told CNBC, "We are not going to see a recession, that is not in my outlook. We are going to see a slowdown, and inflation will get down to 2%."
😰5 charts that show how bad the cost-of-living squeeze is for the average American today.
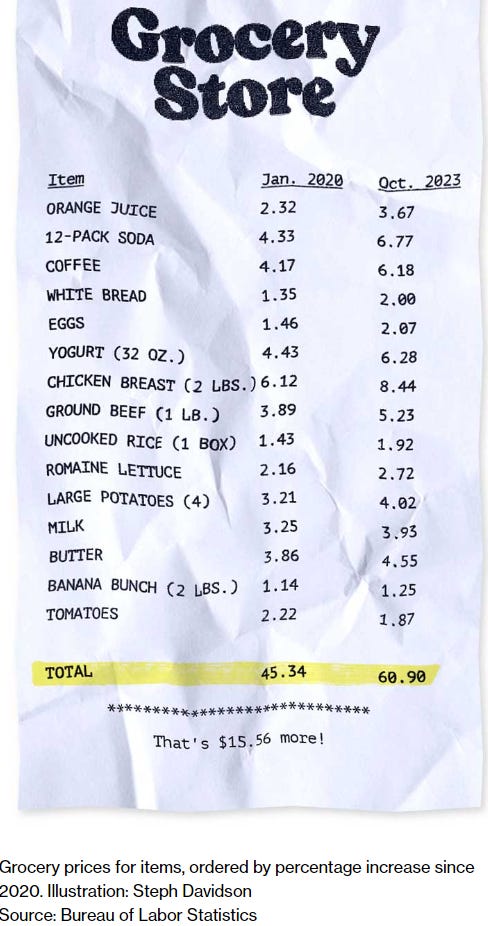
After years of inflation, it’s hard to find an area of a household budget that’s been spared: Groceries are up 25% since January 2020. Same with electricity. Used-car prices have climbed 35%, auto insurance 33% and rents roughly 20%.
➡️Here are 5 charts that illustrate the squeeze:
1. An example of a grocery bill
2. Housing is less affordable for renters and buyers alike
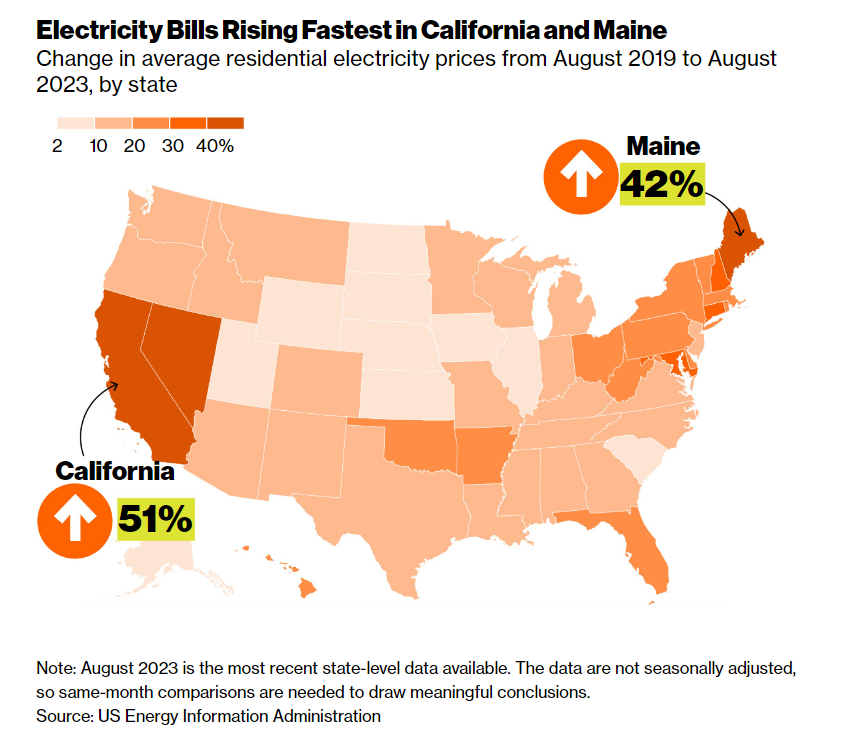
3. Routine bills have exploded, with electricity bills are rising at the fastest rate in California and Maine.
4. Restaurants have passed higher costs to consumers as prices are up 24% since January 2020, excluding tips.

5. While savings rose across all income groups during the pandemic, the padding has gotten thinner, especially amongst the lower income groups.
🏡The typical down-payment for a first time home buyer is at its highest level since 1997. They are paying it using savings, gifts and financial assets.
The housing market is unaffordable for many Americans right now, thanks to elevated home prices and interest rates, which makes the prospect of shelling out for a down payment even more daunting for prospective buyers.
In Monday's post, I laid out the math for down payment and monthly mortgage payment for buying a median priced existing home in the US in 2023 relative to 2020.
3 years ago, the median existing home price in the US was $294K. Today, the median existing home price is up 33% to $392K. Meanwhile, mortgage rates climbed from 2.99% to 7.3% today.
Result: If you are a homebuyer, expect to pay $20K extra in down payment (assuming 20% down payment). And your monthly mortgage payment would go up from $990 to $2200, an increase of 122% over the last 3 years.
Although first-time home buyers rarely shell out 20% in down payment, it is worth noting that the median down payment for first-time US home buyers currently stands at 8%, which marks the highest down payment since 1997, according to the National Association of Realtors.
8% of the median home sale in October, per Redfin, would translate to a down payment of about $33,000.
One of the main reasons why the typical down-payment for first-time buyers is at a two-decade high is because wealthier first-time buyers, who can more easily afford a higher down payment, have been particularly active in the housing market.
"In a still-competitive housing market, more well-off home buyers were able to have their bids accepted by offering larger down payments and even by paying cash," Jessica Lautz, NAR deputy chief economist and vice president of research said.
First-time homebuyers are using savings and other financial assets to get closer to meeting their down payment goals. In fact 71% of first-time buyers cited savings as one of the ways they financed their down payment, compared to 46% of repeat buyers, according to the NAR report.
Plus, 19% of first-time buyers used a gift from a relative or friend, compared to 4% of repeat buyers, while 11% sold stocks or bonds. 9% of first-time home buyers drew from their 401(k) or pension fund, 4% used their inheritance, and 2% used proceeds from cryptocurrency sales.
🤑 Can money buy happiness? Sure it can. Millennials believe $525K in annual salary to be precise.
On Monday, Empower, a financial services company released the results of a survey conducted by The Harris Poll in August that asked 2035 Americans aged 18 and over what they think the key to financial happiness is.
Turns out 59% of respondents think happiness can be bought, and the average person believes it would take having $1.2M in the bank to be truly happy financially.
When it comes to annual salary, the average respondent think they need $284,167 annually to be happy. Here’s what each generation said they need to earn annually, as well as the net worth required, to achieve happiness:
Gen Z: $128,000, with a net worth of $487,711
Millennials: $525,000, with a net worth of $1,699,571
Gen X: $130,000, with a net worth of $1,213,759
Boomer: $124,000, with a net worth of $999,945
Furthermore, a 2023 study co authored by another Nobel Prize recipient Daniel Kahneman found that happiness can improve with higher earnings of up to $500,000 a year, supporting the millennial survey respondents' predictions.
"In the simplest terms, this suggests that for most people larger incomes are associated with greater happiness. The exception is people who are financially well-off but unhappy. For instance, if you're rich and miserable, more money won't help. For everyone else, more money is associated with higher happiness to somewhat varying degrees." Matthew Killingsworth, a senior fellow at Penn's Wharton School and coauthor of the study said.
Still, there's more to it than just the annual salary. According to the survey, inflation, high interest rates, and student loans are weighing on Americans' financial security, and having the comfort to spend money on everyday items can boost the feeling of financial happiness. For example, 62% of millennials said they would be willing to pay $7 for a daily coffee "because of the joy it brings."
📉If your investment portfolio contains primarily dividend ETFs, I am sorry to tell you that you have underperformed the S&P 500.
Last year investors sent $60B to exchange-traded funds focusing on dividends. 11 months later, the trade is misfiring.
Rather than providing shelter in a stormy season, the largest dividend ETFs have been left behind by a tech-obsessed market whose biggest proxies have surged 15% or more. At the bottom of the leaderboard is the $18B iShares Select Dividend ETF DVY 0.00%↑ , down (5.4)% on a total return basis.
The casualty list includes the $20B SPDR S&P Dividend ETF SDY 0.00%↑ , down (3)%, the Schwab US Dividend ETF SCHD 0.00%↑, off (2.4)% and Vanguard’s High Dividend Yield ETF VYM 0.00%↑ , which is mostly flat for the year.
In the case of SDY 0.00%↑ , half of the fund is concentrated in three sectors that have declined this year: consumer staples, utilities and health care. Its top holding, manufacturer 3M Co, has plunged (15)%.
“With a small handful of largely growth-oriented stocks dominating the market’s performance, 2023 was a challenging environment for dividend-paying, value securities, especially with the compelling case for fixed income in a higher rate environment,” said D.J. Tierney, senior investment portfolio strategist at Schwab Asset Management.
The idea that dividends enhance stock returns is a selling point of brokers that is itself subject to dissent. Any payout they provide shareholders is effectively offset by mechanical declines in the price of the stock — the so-called ex-dividend effect — leaving returns mostly a function of stock picking. Plus, this year has been a particularly rough one for stocks valued for their cash flows because of increases in bond yields, which represent competition for investor dollars.





Very interesting discussion about money and happiness here. I would like to mention the decreasing marginal utility that we get for every extra dollar we earn after a certain threshold. If you make $10,000 per year, earning $10,000 extra will probably change your life. But if you make $150,000, making $10,000 extra per year won't make that much of a difference.
It's also interesting to point out that we hardly make absolute judgements — we always compare ourselves to others. It's been shown that if you make, for example, $70,000, and your friends make $60,000, you'd be significantly happier than if you made $80,000 while your friends make $90,000.
Reading your post, I think a hard landing is unavoidable. The example of a grocery bill completely aligns with my recent trip through Florida. I couldn't believe my eyes while I was doing grocery shopping.
It's so sad to see where cheap money has brought us. While the majority didn't benefit from the printing press, they now have to pay the additional bill through inflation😥