


My S&P 500 Target For 2025
Animal Spirits To Make A Comeback?

Welcome back, everyone 👋🏼. First of all, I would like to wish all my readers a healthy and prosperous 2025.
This is the first Monday Macro post of 2025. It is also my first post since September of last year.
Due to personal matters, I took an extended time off from the platform.
So, to all the new subscribers since then, welcome to The Pragmatic Optimist.
I am also incredibly grateful to all my paid subscribers for being patient with me during this period of time. 🙏🏼🙏🏼
Having said that, The Pragmatic Optimist will take a more investment-focused approach in 2025 pertaining to the AI ecosystem.
I will send out “The Future of The Pragmatic Optimist” post this Thursday to better align the publication’s renewed objectives with readers’ interest.
Meanwhile, our agenda for today: go back to the basics with a good ol’ fashioned Macro post to answer the one big question that is on every investor’s mind, “Are animal spirits going to make a comeback in 2025?”

«The 2-minute version»
Just when we thought that investor sentiment might go to infinity, the Fed put the brakes on with its 2025 roadmap, where they project far fewer rate cuts than was originally anticipated. Worse, they did not rule out a rate hike next year if warranted.
But first, let’s get something straight: The US economy has thus far proven exceptionally resilient to a high interest rate environment. Part of the reason behind this miracle is that both consumers and corporations had locked in low interest rates during the pandemic, while fiscal policy has been highly stimulative.
Then, why is the bond market freaking out? However, with the Fed’s latest 25 bp cut in December, the bond market is signaling the Fed to slow down its rate cuts, or halt altogether. Meanwhile the yield curve has steepened with rising term premiums as inflation prints have been moderately ticking up higher, rejecting the Fed’s monetary policy.
Refresh my memory on liquidity again: At a high level, liquidity conditions look fine for now. But, reverse repo facility now sits at its lowest level since 2021, while bank cash levels as a percentage of total assets are down to the March 2023 levels, when the regional bank crisis happened. Add to that, the avalanche of Treasury bill issuance that is coming up in 2025, and suddenly it feels like we are on thin ice.
More moving parts: With the re-election of Donald Trump as the President of the US, his key policy objectives are 1) low taxes, 2) higher tariffs, and 3) reduced immigration. While lower taxes could boost consumer spending and corporate profits, tariffs and constrained migration may add inflationary pressures and dampen growth prospects. A real tug of war, I must say.
Yet, the S&P 500 earnings are projected to grow 15%: Up until now, the story was centered on the profit margin expansion from the Magnificent 7, thanks to the AI infrastructure boom. However, in 2025, we should see earnings breadth expand across the 493 other companies in the index, while the contribution of the Magnificent 7 to overall earnings growth will slow down slightly.
Putting the bull market in context: Looking at the big picture, the current bull market is only 26 months old. That is very young, compared to historical averages. Yet, it is also one of the most expensive ones, driven by the Top 10 companies in the index. While market valuations do not impact much about forward market returns over shorter time horizons, they tend to matter over longer time frames.
Is a bubble all that bad? While a bubble always has a negative connotation, they often help pull the future forward by concentrating a tremendous amount of financial and human capital on very specific visions of the future. Think The Manhattan Project or Moore’s Law. Are we in one such inflection bubble? Hard to say, but until we see material signs of consumer and corporate weakness, there is a path to 6500 or higher for the S&P 500.
🎥Let’s set the stage.
A few months, I read this post by
,“Let us pause to appreciate the remarkable US economy”, where he highlighted the four things that we should want from a well-functioning macroeconomy.You want high employment rates so that everyone who wants a job has a job.
You want low and stable inflation rates so that people know how much a dollar will be worth a month from now.
You want fast wage growth so that regular working people are taking home their share of economic growth.
And you want fast productivity growth, because ultimately that’s what creates durable gains in living standards.
Checking back on these above indicators three months later,
Unemployment rates remain at 4.2%, with the unemployment rate for people in the 25-54 age bracket at 3.7%.
Inflation, as measured by the Fed’s preferred Core PCE, has come down from its peak of 5.6% to 2.8% YoY, while the 10Y breakeven inflation remains anchored at 2.39%.
Meanwhile, average hourly earnings are growing at 4.0% YoY, with real wages growing steadily, boosting consumer confidence and spending levels.
Finally, labor productivity has also returned to a historically average level while beating the levels seen during the last decade.
With the US economy exceptionally resilient to a high interest rate environment, where a large number of consumers and corporations locked in low long-term rates during the pandemic, along with a highly stimulative fiscal policy, it has demonstrated its exceptionalism on a global landscape.
The performance of the S&P 500 over the last 12 months is a perfect example to demonstrate US exceptionalism, with the index creating 50 new highs as it climbed 23% during 2024. Sure, the megacaps played a significant role, where the Magnificent 7 stocks were responsible for more than half the index’s gain during this period of time, thanks to the accelerated investment amidst an AI arms race and fiscal support from legislation such as the CHIPS Act.
And just when we started scratching our heads as to how much further investor optimism can stretch, the Fed gave us an updated roadmap for 2025, where they projected far fewer rate cuts for 2025 than the markets were projecting. In fact, they did not rule out a rate hike next year if warranted 🤯.
Not the speed bump that the bulls were looking for.

With the Fed funds rate and the 2-year US Treasury bond converging, liquidity on thin ice, and the cross-currents of tariffs, taxes, and immigration policies, investors suddenly feel a little unsettled.
But if there is one thing that this 26-month-old bull market has taught us, it is that it’s a bull market until proven otherwise.
Yes, there are lots of moving parts.
But, with the S&P 500 projected to grow its earnings by 15% in 2025, the question is, are animal spirits going to come back with a vengeance in 2025?
In order to find that out, we need to disentangle the maze of all the moving parts one step at a time. So, take a large cup of coffee ☕ and a muffin 🧁 as we dive into the deep end.
A fresh look at the bond markets
Remember the time when market analysts thought that the Fed would have to induce a recession through interest rate hikes in order to win its battle against the monster named “Inflation”?
Well, as it turns out, even after the Fed raised interest rates at the fastest pace in this century from 0% to its peak at 5.25-5.5%, while simultaneously reducing the size of its balance sheet through QT (Quantitative Tightening), the US economy did not see a material weakening in overall GDP.
Starting in September 2024, the Fed finally embarked on its monetary easing journey to best navigate its dual mandate of “stable prices and maximum employment” and has thus far delivered four rate cuts, bringing its fed funds rate to a range of 4.25-4.5%.
However, with the latest 0.25 basis point cut it delivered in December, we have seen the 2Yr US Treasury yield and the Fed Funds rate converge, an early warning sign by the bond market politely asking the Fed to stop cutting rates.

Meanwhile, the 10 Yr US Treasury bond yield is now up more than 100 basis points since the "Fed pivot" began in September to 4.68%, while the 10 Yr TIPS (yield excluding 10Yr breakeven inflation) rose 74 basis points to 2.27%.
This is leading to a bear steepening, a phenomenon in yield curve dynamics, where the long-dated yields take the lead, hence shifting the entire curve higher and steeper, tightening overall financial conditions.
One of the driving factors for the bear steepening could be that the Fed is easing at a time when nominal growth remains robust, with inflation remaining above the Fed’s 2.2% target. In fact, if you look at the 3-month annualized Core CPI and Core PCE, they are rising once again, while inflation expectations as measured by NY Fed have also been ticking higher.

In fact, Jim Bianco from Bianco Research uses the trend of inflows/outflows into TLT 0.00%↑ (one of the most influential 20-year Treasury bond ETFs) as a perfect example to explain that the bond market has been rejecting the Fed policy as of late.
From the day the Fed started hiking (March 16, 2022) to the November 7, 2024, FOMC meeting, cumulative inflows into TLT (one of the most influential 20-year Treasury bond ETFs) were steady, totaling over $55 billion.
A reasonable interpretation is that bond investors agreed with the Fed's policy from March 2022 to November 2024, even if it was hiking, as it was fighting inflation.
However, since the Fed cut again in November, bond investors have reversed and fled the bond market. Almost $10 billion has left TLT.

But the Fed easing during a period of nominal growth with inflation above 2.2% is not the only driving factor behind the bear steepening.
The insane rise of US deficit spending is the other one. In order to explain how the rising level of the US deficit plays a role in higher long-term yields, we need to go down untangling the maze of “liquidity.”
Liquidity is on thin ice.
But before we proceed, I will quickly pause to clarify that liquidity refers to bank reserves, which is interbank money that can only be exchanged within the banking system to buy bonds, engage in repo transactions, or settle payments using bank reserves.
Another way to think about it is the more ''liquidity'' in the interbank system, the more banks will be able to engage in repo transactions, buy more bonds, etc.
Coming back to the state of liquidity and taking a “top down” approach, things look just fine. As the Fed continues to perform quantitative tightening while the Treasury drains out the reverse repo facility through its issuance of T-bills, domestic liquidity conditions continue to be range bound.

However, when we peel the next layer of the onion 🧅, we can see that the reverse repo facility is drawn down from a peak of over $2.1T to below $168B for the first time since 2021.

(A bit of context: The reverse repo facility was initiated in 2013 for banks and wealthy investors, awash in cash to park or at the Fed. But, it wasn’t until the Covid pandemic that the reverse repo facility reached a peak of $2.1T, and ever since then, the Treasury has been teasing capital out of it through short-term Treasuries, or T-bills.)
Meanwhile, bank cash levels as a percentage of total assets are also back down to near where the March 2023 regional bank crisis occurred, but above the levels where the September 2019 repo spike occurred. In fact, the Fed’s repo facility was tapped for the first time in over 4 years at the end of Q3 2024, an early warning sign of tightening financial conditions.

Complicating matters further, the US debt levels will continue to balloon up from current levels, with little or no signs of slowing down.

The overall federal debt has more than doubled over the past decade, to nearly $36T, with estimates that it will increase to over $54T by 2034. With deficits projected to grow to over 7% as a percentage of GDP, the central question is: who is going to buy all that debt?
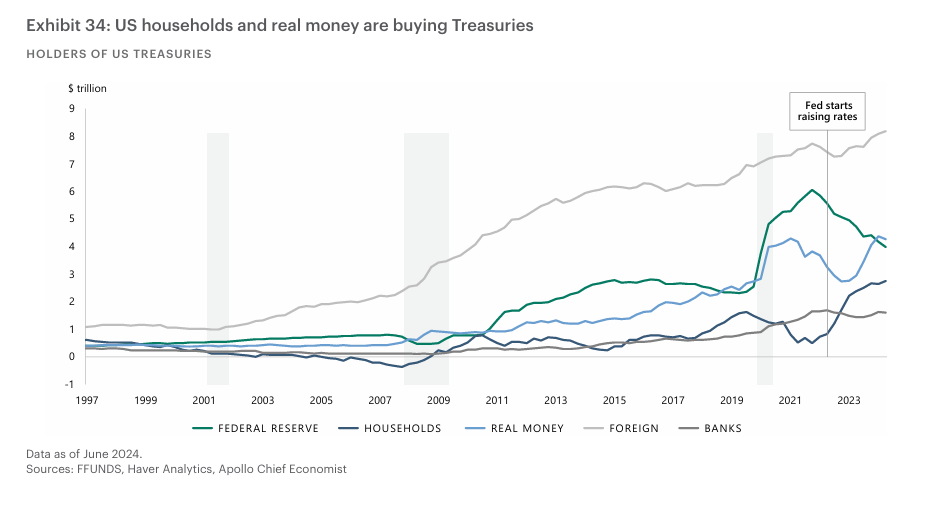
With foreign holdings of US Treasuries as a share of total outstanding debt falling, American households and institutional money such as pension funds and insurance companies have been picking up the slack. But if the Fed insists on interest rates coming down, at what level of yields do these investors stop buying Treasuries or T-bills?
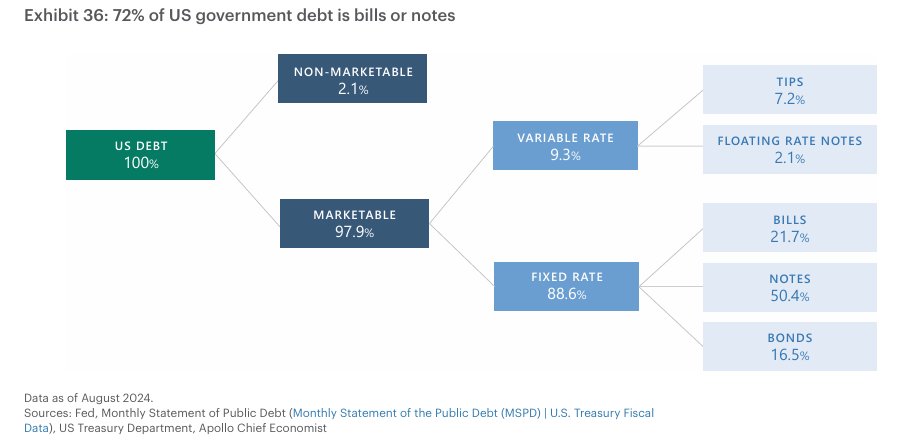
Therefore, in order to minimize the impact of any uncertainty surrounding the demand to absorb the supply of bonds, the US government has been issuing more and more T-bills to cover their deficit while betting that long-term rates will go down before they dump tons of longer-term paper on the market.
Below is an illustration of the composition of the US debt that shows that 72% of it consists of bills and notes.
Moving forward, the Treasury plans to 1) fill the Treasury General Account (think of it as the Treasury’s checking account with the Fed) back up to $850B and 2) borrow an additional $823B in Q1 2025.
had written this must-read post, where he dropped this chart below that showcases that the Treasury is planning to soak the market in T-bills in early 2025.
Unfortunately, the rabbit hole doesn’t end there.
brought up an excellent point in his LinkedIn post, where he argued that the US will also face a $7T maturity wall next year, given that T-bills mature quickly together with older bonds.So, connecting the dots, aside from inflation prints ticking higher, the bond market also knows that the Treasury is just kicking the can down the road and will soon have to dump a heap of 10- to 30-year US Treasuries on the market. As a result, investors are unwilling to take the risk and are thus demanding higher risk premiums.
As for where liquidity is headed next, I expect the Fed’s QT to end relatively soon, especially as the reverse repo facility is drained out and bank cash levels trend downwards.
With deficit spending showing no signs of slowdown, we are near the danger zone, where once bank reserves drop below $2.9T, 10-Yr US Treasury yields will likely spike higher due to a lack of sufficient liquidity to soak up Treasury issuance, at which point the “money printers go brrrrr, once again.”

A tug of war given the policy trifecta of taxes, tariffs, and immigration
Now that we have discussed the current state of the bond market that is rejecting the Fed policy and liquidity that seems to be on thin ice, especially with the avalanche of Treasury issuance coming our way, it’s time to move on to the next moving part.
That is, the macro policy surrounding taxes, tariffs, and immigration and its impact on inflation and growth.
Starting at the high level, with the re-election of Donald Trump as President of the US, his key policy objectives include lower taxes, higher tariffs, and reduced immigration.
On the tax front, the tax package that President Trump enacted in his first term will now likely be fully extended, rather than expire at the end of 2025 as previously legislated. Meanwhile, President Trump has also discussed the potential for reducing the corporate tax rate further from 21% to 15%, additional tax cuts for households such as removing taxes on tips and overtime, as well as deregulation in a number of areas.
On one hand, Bank of America Bank estimates that cutting the statutory US corporate income tax rate to 15% from its current 21% could add nearly $100 billion to earnings in 2025.

On the other hand, given the stimulative nature of tax cuts to the economy, this can unsettle the bond market with the current levels of fiscal deficit and debt as a percentage of GDP rising over 120%. Therefore, what is put in pockets via lower taxes could be taken out in the form of higher mortgage and corporate borrowing rates, as long-term Treasury rates move higher.
Meanwhile, an area of growing economic concern is the Trump Administration’s stance on tariffs, where he has proposed a 10% tariff on all imports and a 60% tariff on all Chinese goods. If these tariffs were enacted as stated, they could lead to higher inflation and reduce overall demand, as well as higher interest rates and a stronger U.S. dollar, thus offsetting some of the stimulative effects from lower taxes.
In fact, Goldman ran a survey across 500 of its institutional clients, and it is tariffs that concern investors the most. Roughly 60% of respondents feel tariffs are the greatest policy risk in 2025, followed next by concerns over the nation’s increasing debt load.

Not to mention that the uncertainty that arose from Trump’s first trade war did coincide with a dramatic decline in US business investment.

Finally, tackling migration was one of the issues at the heart of Trump's campaign, and he has promised draconian immigration curbs and large-scale deportations. This will impact the labor market. It's worth remembering that the massive increase in immigration in recent years, while clearly upsetting the electorate, has played a major role in the US's ability to maintain a strong rate of growth and at the same time bring down inflation. A significant reduction in migrant workers could reignite wage pressures and inflation concerns.
To get an understanding of how the policy trifecta will impact inflation and growth in terms of actual numbers, here’s how JP Morgan and Goldman Sachs lay out their projections.

Like I said, a legion of moving parts, each with its own shade and nuance.
Yet, none of the projections point to a material slowdown, as we can see above.
And there are good reasons for that.
Let’s move on to the next section to find out why.
The US consumer continues to defy any predictions of a slowdown.
With retail sales ticking higher to 4.1% YoY in November, consumer spending is strong and broad-based across categories. In fact, when we look at some high-frequency data that provide a real-time window into the health of the economy, we can see the following:
People are still going out to restaurants 🍝

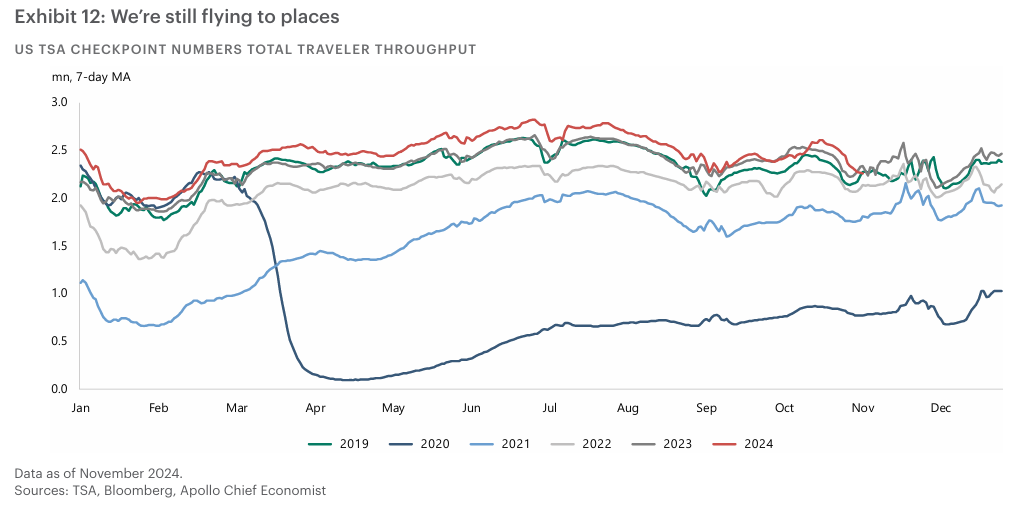
People are still flying on airplanes ✈️
…and we are still going to the movies 🎞️

Not to mention, US consumers spent a record $241.4B online during the 2024 holiday season, up 8.7% from 2023.
This is in part due to average hourly earnings growing at 4.3% YoY, faster than the overall pace of inflation, which has been boosting consumer confidence.
Although one might caution against the ballooning credit card debt amid a low savings rate, the ratio of credit card debt to disposable income is at very low levels for US households, thanks to a solid labor market, bolstering US household balance sheets.

In the meantime, household net worth has increased nearly $4.8T, or 2.9% from the prior quarter to $168.8T, given the price appreciation in both equity holdings and real estate.
You see some 95% of mortgages in the US today have a 30-year fixed rate. So when the Federal Reserve began to raise interest rates in 2022, it didn’t have much of an impact on the cost consumers face to service their existing mortgages.
To this point, Apollo Research rightfully points out that there is a growing discrepancy between the “haves” and the “have-nots,” whereby the “haves” have generally benefited in a high-interest rate environment, while the “have-nots,” not so much.
Low-income households have aggregate savings that are lower than where they were in 2019. On the other hand, those households at the top of the income distribution are benefiting from increases in both stock prices and home prices. On top of that, high-income households that own fixed-income instruments—both public and private—are also benefiting from rising cash flows due to high interest rates. Considering that the top 20% of incomes account for 40% of consumer spending, it’s no surprise that the economy is holding up well.
While American businesses are in the midst of a historic profit boom
Similar to the unbreakable consumer environment, large corporations have also hugely benefited by locking in low interest rates during the pandemic era, which have made them significantly richer by lowering their interest expenses while expanding their cash on their balance sheets.
Coupled with the investment boom from AI, with capex (capital expenditures) from the five hyperscalers projected to reach $1T by 2027 as per S&P Global, the top 10 stocks in the S&P 500 are now responsible for over 40% of R&D (Research & Development) expense.
Add fiscal policies such as the CHIPS Act and the Infrastructure Act, and the US economy has seen a boom in construction spending on everything from semiconductors to electric vehicles, batteries, solar panels, etc., marking a very important moment of industrial renaissance for the country.
All in all, American businesses are in the midst of a historic profit boom, as can be seen below.

Along with that, CFO optimism about the overall economy has been increasing sharply and broadly in Q4 relative to Q3, suggesting a positive forward profit outlook amid a robust capex environment.

Although smaller companies, particularly the ones in the Russell 2000 complex, have not benefited from the higher interest rate regime, with 50% of the debt at floating rate, compared to 24% for the S&P 500, we have recently seen the NFIB Business Optimism Index soar a record 8.0 points in November to 101.7, the highest level since June 2021, as small businesses expect to benefit from tax cuts and other pro-growth Trump policies.
Earnings breadth to widen in 2025, while AI continues to be a focal point
However, if there is one thing that has truly supported the rally in the S&P 500 since October 2022, it is the profit margin expansion from the Magnificent 7, thanks to the AI boom.
With the Magnificent 7 accounting for 63% of the S&P 500 returns in 2023 and 47% in 2024, it highlights how important just a small number of companies linked to AI has become for the S&P 500.
According to data from S&P Global, just five AI hyperscalers are currently projected to spend more than $1T in capex collectively from 2024 to 2027, which in turn is driving massive revenue expectations for AI hardware names.
Take Nvidia NVDA 0.00%↑ for example, where it has seen its annual revenues grow from $4B in 2014 to $61B in 2024.

Yet, when we look forward to 2025, we can see that the contribution of earnings from the Magnificent 7 to the S&P 500 is expected to decelerate. With markets currently expecting the S&P 500 earnings growth to accelerate to 15% in 2025 and 13% in 2026, earnings growth for the Magnificent 7 is expected to decelerate to a 20% annual pace (still strong). This means that the other 493 companies need to be pulling the weight, especially as they benefit from lower costs of capital, corporate tax cuts, and favorable deregulation policies.

This is not to say that investment in AI will take a backseat. Au contraire.
With hyperscalers projecting to spend roughly $200B in 2025 in capex, it should benefit areas of the market like data centers and real estate, engineering and construction, nuclear and renewable power, energy transmission, gas-powered electricity, cooling technologies, and the electrical components that connect it all.
However, I would like to emphasize that we are still in the AI’s buildout phase, where investor excitement has primarily been anchored in hardware and hyperscalers.
The good news is that AI adoption appears to be increasing. McKinsey’s Global Survey on AI from earlier this year, for example, showed that the proportion of companies that have adopted AI in at least one business function had jumped from 55% in 2023 to 72% in 2024, with an even greater jump in the proportion of businesses using generative AI.
With Jensen Huang confirming that the next stage of AI after generative AI is agentic AI (i.e., “agents”) at the latest CES event, we can expect the adoption curve, especially for enterprises, to accelerate from current levels.
Meanwhile, Bain made a bold claim in October suggesting that every client that integrates genAI into its business operations could boost their earnings by 20% within 18-36 months. According to them, if this is applied to every company globally, it could raise world GDP by 2%, highlighting the payback period of AI investment could be much shorter than many expect.
There is a path to 6500 for the S&P 500.
For those of you who are familiar with my work, I take a fundamental approach where I lay out my scenarios and use an implied equity risk premium model (originally developed by ) to determine the range of possible price targets across each of the scenarios.
I would like to note that these scenarios are very fluid, just like the economy is.
Most importantly, I don’t treat them as “year-end” targets, as I find that concept highly sensational and inaccurate for the most part.
Having said that, you can check out the methodology that I use to compute the price targets from my earlier post that I have linked below.

Now, without any further ado, I present to you my 2025 Macroeconomic Scenario Map.

Here’s a description of each of the scenarios below:
Status Quo: GDP growth remains resilient at 2.1%, given the boost from favorable stimulative policies such as corporate tax cuts, which is partially offset by tariffs that are levied against China. While the US administration stops short of a universal tariff, inflation remains above the Fed’s long-term 2.2% target. This will force the Fed to remain firm with its monetary policy stance while managing optimal liquidity conditions in the broader financial market. In the meantime, earnings growth broadens across sectors. However, given where the index is currently trading, there is little room for upside in this scenario.
Productivity Acceleration: GDP growth accelerates, driven by corporate tax cuts and deregulation policies, along with an AI-induced productivity boom. On the tariff front, trade tensions ease and geopolitical tensions calm, while the rising productivity keeps inflation in check despite a tight labor market (from Trump’s immigration policy), allowing the Fed to cut interest rates at a slightly faster rate than it currently expects. This should support outperformance across both stocks and bonds, with the index reaching new highs between 6400-6800.
Higher for longer: In this scenario, inflation turns out to be a bigger headwind than the markets expect it to be, given a combination of lower taxes, higher tariffs, and a ballooning debt. This might result in the Fed delivering fewer than expected cuts or, worse, raising rates. However, if wages continue to grow in line with inflation, the overall demand should not materially weaken. As a result, growth will still be positive. Negative for stocks in interest-rate-sensitive sectors as well as fixed income.
Deflationary Recession: Tough protectionist measures and geopolitical uncertainty hit business and consumer confidence, forcing companies to pull back on hiring. Tariffs are levied on China, but companies are forced to absorb higher prices through weaker margins given lower consumer confidence. Interest rates are cut by considerably more than currently priced to support the economy. Stocks hit hard, while fixed income and gold will outperform.
Stagflation: A global trade war leads to a re-acceleration in inflation while hurting growth across the world. Punitive tariffs on China stymie a recovery despite stimulative policies. Along with that, tax cuts and anti-immigration policies fuel US inflationary pressures, while oil prices remain elevated with tensions in the Middle East offsetting increased US production. The Fed is unable to cut rates to support the growth outlook given elevated inflation, with stocks within interest-rate-sensitive sectors hit the hardest, along with losses on fixed income from rising yields.
Putting the bull market in context, Is a bubble all that bad?
The current bull market is nearly 26 months old and is up over 70% during this period of time.
While the duration and returns may seem extraordinary, it is actually below historical averages when you zoom out.
For context, the average duration of the last six bull markets is 2510 days, while the average return is 259%.
The above numbers would almost make the current bull market seem like a baby.

However, the S&P 500 is trading at one of the most expensive valuations, with a forward price-to-earnings ratio of 22, the highest level since the dot-com bubble.
had written this post, where he explained that while market valuations do not impact/explain much about forward market returns over shorter time horizons, they tend to matter over longer time frames. Put simply, higher price-to-earnings multiples have led to market underperformance over longer periods of time, as can be seen below.
Yet, despite being one of the most expensive markets in history, there is a massive valuation discrepancy between the tech and the rest, where the largest 10 stocks in the index now trade at a forward price-to-earnings multiple of 30, compared to a multiple of 18.2 for the remaining 493 companies in the index.

Like I said, lots of moving parts and lots of contradictory signals.
Yet, if there is one thing that we should take away from 2024, it is that it is particularly hard to vanquish a bull market. In 2024, we saw narratives flip-flop, yet the markets kept climbing higher as inflation trended downwards while earnings continued to surprise on the upside.
Sure, the bond market is very unsettled and has completely rejected the Fed’s monetary policy.
Liquidity is on very thin ice, with the barrel of reverse repo almost depleted.
The impact on inflation and GDP from the policy trifecta of higher tariffs, lower taxes, and constrained immigration is not fully known.
Questions around AI overinvestment are valid, and we may enter a period (temporary though, I think) of AI pessimism that can take some froth away from the market. To this point, though, I believe that the strong fundamentals of the mega caps, both relative to other parts of the S&P 500 as well as relative to the 2000s tech bubble, should prevent a major catch-down.
Finally, the importance of the large budget deficit and the ballooning of national debt that has surpassed $36T will only rise in importance, including the complex ways it can impact the economy and the markets. In all honesty, it's unclear where the limits of this borrowing are.
While investors worry that the growing debt levels could hamper the government’s ability to roll its debt, leading to skyrocketing interest rates and possibly losing the world’s reserve currency status, ironically, the best time to invest over the past two decades has been when the deficit was its largest.
Therefore, in times like these, I believe it is important to remain pragmatic and manage your risk levels accordingly in order to avoid/minimize expensive mistakes.
Will the S&P 500 reach 6500 or higher? Sure, as long as inflation comes at or below estimates with the 10-Y breakeven anchored, along with an at or above average earnings surprise, consumer and corporate sentiment should remain robust as we navigate through the maze of many moving parts and sometimes contradictory data.
That doesn’t mean that there won’t be a sizable pullback during its journey towards the 6500 target.
It is also possible that we may see a fundamental shift in the bull market narrative, though there aren't any compelling signs of a slowdown yet.
To conclude on a pragmatically optimistic note, I will leave you with some hard-hitting excerpts from
post in November, “The Trump Bubble” .A Trump Bubble might sound alarming. After all, both Trump and bubbles get a bad rap, both at least partially deserved.
When you hear the word “bubble,” you might think, “Overinflated thing that is bound to pop.”
In Boom, Byrne and Tobias distinguish between the two kinds:
Mean-reversion bubble: “the basic bet is that the future will continue along present trends.” Think: the mortgage crisis. If you bet that the future will look mostly the same, you can take on debt to lever up your bet.
Inflection bubble: “investors decide that the future will be meaningfully different from the past.” Think: the dot-com bubble. If you think that the future will look meaningfully different, you buy equity in the things you think will benefit most from the difference.
Inflection bubbles, they argue, drive progress. The Manhattan Project succeeded because definite optimists were powered along by bubble dynamics. The same could be said of Apollo.
Bubbles pull the future forward by concentrating tremendous amounts of financial and human capital on very specific visions of the future.
Things that may not have happened - ever - without a bubble, happen rapidly with them.
The Trump Bubble, if it materializes, will be about upgrading and cleaning the gunk out of the machine that builds the machines that builds the machines so that it can run at full capacity.
While the Manhattan Project and the Apollo Program are the two case studies in the book with direct government oversight, I think the Trump Bubble will look more like Moore’s Law.
“Moore’s Law,” Byrne and Tobias write, “is perhaps the most compelling and enduring example of a two-sided bubble, wherein the expectation of progress in one domain spurs progress in another, which then propels growth in the first.”
The Trump Administration is telling people that it will be easier to build, invest in, and accomplish big things, which is already making people more excited to build, invest in, and accomplish big things. The more energy and excitement there is behind what people are building, the easier it will be for the government to fix the machine.
By making it feel like change is possible – again, even if it’s just people projecting their hopes that change is possible – the Trump administration is making it cool to work with the government again.
Bryan Johnson is getting involved. Elon Musk, the world’s richest person, the guy who just caught a 22-story rocket with chopsticks, is getting involved. Regular geniuses who never would have considered working with the government are trying to figure out how to get involved.
Sequoia’s Sean Maguire said that he’s getting messages from physics PhDs asking how they can work in the Trump government.
This is parallelization and coordination at national scale. Parallelization because so many entrepreneurs want to build within an American machine that they expect to run more smoothly. Coordination because so many talented people want to get involved in actually fixing the machine itself, now that they think there might be a chance to.
The beauty of an inflection bubble is that even if some investors’ equity goes to zero, no contagion will set in and the world will be left with more progress on hard challenges than would have been made otherwise. Eventually, certain companies that might not have made it otherwise, will, and those companies will change the world for the better.
Will it be perfect? No. It will be messy and volatile. But it will, I believe, lead to spectacular results.
On that note, I once again wish everyone a wonderful 2025.
I hope you enjoyed reading this post, and stay tuned for “The Future of The Pragmatic Optimist” coming out this Thursday, where I will outline the updated vision and roadmap for where we are headed next so that readers (both paid and curious) know what to expect from the publication.
Please feel free to leave any questions or comments in the section below.
This is excellent. When you have some time, would you be interested in guest posting on my newsletter?
I thought you were dead haha. Welcome back Amrita, I do hope you enjoyed your break.