US Residential construction activity is up 14% YoY. Is the US housing market set to boom once again? | Part 2
While the construction activity in the single-family housing market is improving, it's the opposite for multi-family housing. If mortgage rates have peaked & liquidity improves, what happens next?
Welcome to Part 2 of The Pragmatic Optimist’s Housing Deep Dive series.
««Monday Macro- The 2-minute version»»
Overview: Building permits and units under construction for single-family housing has climbed 14% on a year-over-year basis, after bottoming in December of last year. Building permits are the most reliable leading indicator of residential construction spending. Permits come before construction begins.
Which begs the question: While both permits and units under construction are below their all-time highs, are we about to see a US housing boom, given the underlying strength in construction activity and future direction of mortgage rates?
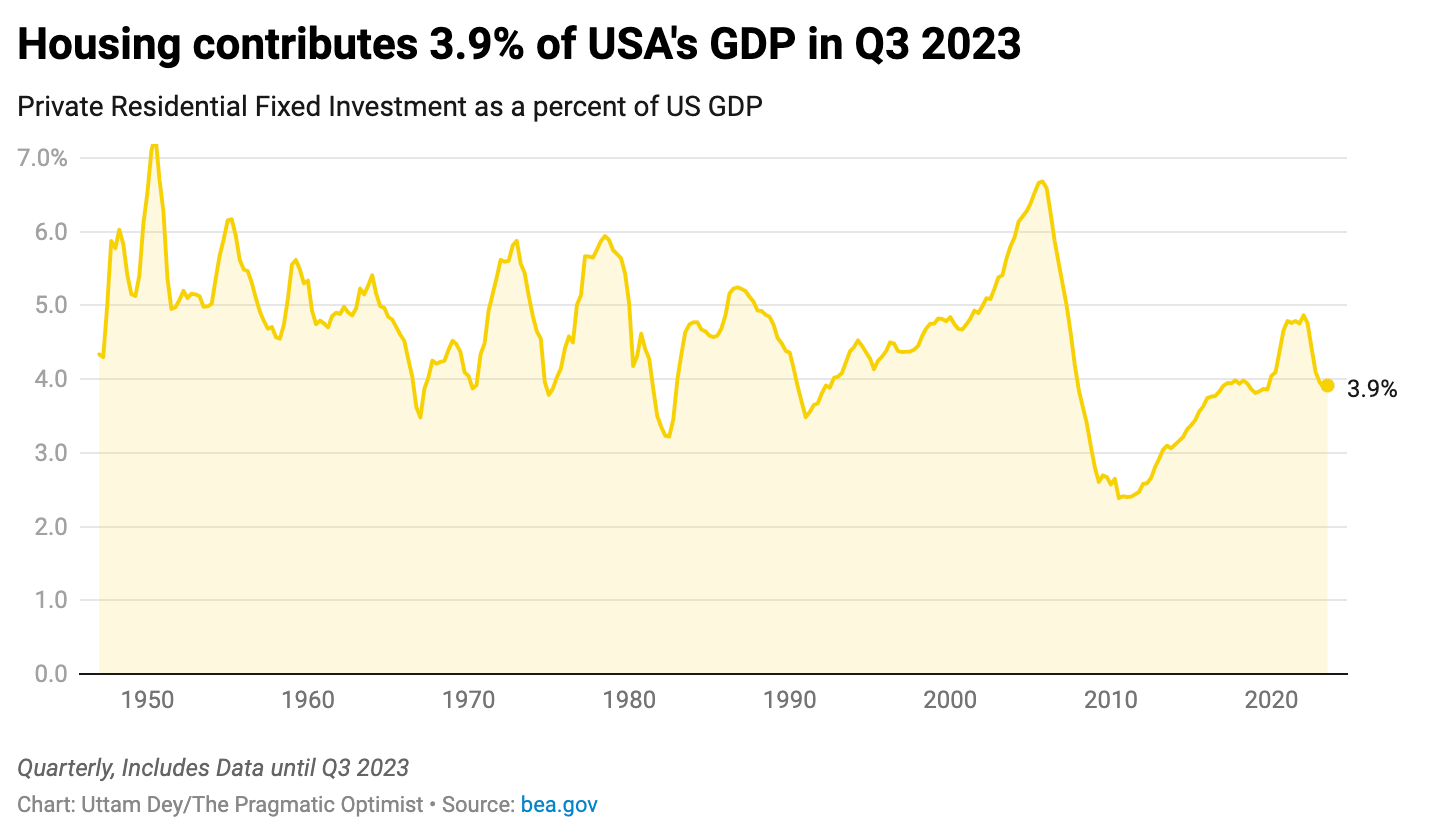
Why it matters? While residential construction spending makes up only about 3-6% of the total economy, the high multiplier nature of residential construction makes it extremely influential despite its relatively small size. As of Q3 2023, the residential housing sector is contributing 4% to US GDP, and while the overall impulse is still negative, it is narrowing quickly.
What does the data say? After peaking in May 2022, the construction activity in the US single-family housing market declined sharply. In comparison, the construction activity in the multi-family housing market held up much better until building permits started declining in October 2022, followed by a sharp decline in units under construction from May 2023 onwards. Meanwhile, construction activity in the single-family housing market has considerably improved and is continuing to show strength. This has also enabled residential employment to remain resilient.
Tying it all together: Given the current strength in the construction activity in the US single-family housing sector, its future direction is dependent on where mortgage rates, real Fed funds rate and overall liquidity trend from here onwards. Since November, mortgage rates and real Fed funds rate have come down, while overall liquidity has improved, which is positive for the future of the US housing market. However the big unknown in all this is going to be the magnitude of the drag from the construction activity in the multi-family housing market.
A quick recap and what’s in store for today!!!
Last Monday, we discussed that the US housing market was experiencing a peculiar phenomenon, where the average national home prices continue to climb higher, despite 30Y fixed mortgage rates near its highest level in this millennium. Common sense dictates that when mortgage rates go up, housing demand falls, which leads to a decline in home prices. Not in this economic cycle.
We identified that the main culprit in all of this is a lack of adequate housing supply. Demand in the existing home market has collapsed, down (40)% from its all time high with inventory below pre-pandemic level. Meanwhile, the dynamics in the new home market is slightly different. While demand has picked up in the new home market, homebuilders are slashing prices to move inventory, resulting in the median prices for new homes down (15)% from its peak. Still, with home prices and mortgage rates at current levels, the US is facing one of the most severe housing affordability crisis.
➡️➡️➡️In today’s post, we will dive into the leading indicators that may help predict the future direction of the housing market in the US.
Remember that there are 2 different cycles in the housing market. There is a “volume” cycle and a “price” cycle. “Volume” refers to the volume of activity such as the level of construction and the number of sales and since volume leads price, we will focus on the residential construction spending cycle in this post.
The post is broken into 4 sections. In this post, we will 👇🏼👇🏼
Determine how big the US housing market is.
Deep-dive into residential construction activity data for single and multi-family homes.
Assess how it has impacted residential employment.
Connect the dots between residential construction activity, employment and the future direction of monetary policy to determine where we might be headed.
How big is the housing market?
The construction cycle in residential housing is the most important cycle in the economy. The residential construction sector is often referred to as “Residential Fixed Investment” and although the sector only makes up about 3-6% of the total economy, the high multiplier nature of residential construction makes it extremely influential despite its relatively small size.
Whenever there is a big decline in the residential construction spending, a recession or a sizable economic downturn in the broader economy usually follows.
The next chart plots the rate of change of the housing sector as a share of GDP. The latest value in Q3 in 2023 tells us that the residential construction sector was contributing (0.5)% less to overall economic activity on a year over year basis. You can see that in Q1 2023, the residential construction sector was contributing close to (1)% less to overall activity compared to the previous year. And since then, the negative contribution from residential construction to GDP has narrowed.
In the prior time periods, we have seen that when the housing impulse in the economy is this negative, it is highly common for the economy to already be in a recession. There is also a relationship between the depth of the housing downturn and the severity of the recession. You can see that is the case with the 1974 recession, early 1980’s double recession and 2008 recession, representing recessions with large negative contributions from housing.
So far, we have established that the housing sector is contributing roughly 4% to overall GDP in the US as of Q3 2023 and while the overall impulse is negative, it is narrowing. So, let’s turn our attention to the level of residential construction spending in the economy.
Construction activity in the single-family housing market may have bottomed. Meanwhile, the picture in the multi-family housing sector looks grim.
In this section, we will look at the level of residential construction spending in the economy. Residential construction spending peaked in May 2022. Since April 2023, the level of residential construction spending has improved and is up 0.9% on a year-over-year basis. Residential construction spending has 3 major components- New Single family construction, new multi-family construction and re-modelling or residential improvements to existing homes.
(Note that although residential construction spending has improved from its lows, it has not reclaimed its previous high).
However, construction spending is reported in nominal dollars. And the price of many items used in residential construction has skyrocketed in recent years. Therefore, a more reliable metric to track would be the units under construction for both single and multi-family homes to remove the effect of prices and get a cleaner read on the actual level of construction activity.
The chart below shows the total number of units under construction in the USA. Mirroring the trend in construction spending, total units under construction peaked in May 2022. However, unlike nominal construction spending that is growing at 0.9% on a year-over-year basis, we can see that total units under construction is still declining (4.2)% on a YoY basis. The important thing to note is that the negative impulse is narrowing since a local bottom in April 2023 (similar to construction spending).
But before we look into the units under construction in the single and multi-family housing market, we first need to bring building permits into focus.
Building permits are the most reliable leading indicator of residential construction spending. Permits come before construction begins. While total residential construction spending peaked in May 2022, building permits peaked in December 2021. There was a similar lead time between building permits and construction spending in the 2006 cycle.
Similar to construction spending, building permits have improved since January 2023, 4 months before construction spending bottomed. While building permits are still declining (3.7)% on a year-over-year basis, the negative impulse has narrowed since January 2023.
Building permits in single-family housing peaked in January 2022 and fell to its lowest level in December 2022, down (40)% on a YoY (year-over-year) basis. Since then, building permits in the single-family housing market has picked up, climbing 14% on a YoY basis as per the latest reading in October 2023.
(Please note that single-family building permits have not reclaimed its all-time high).
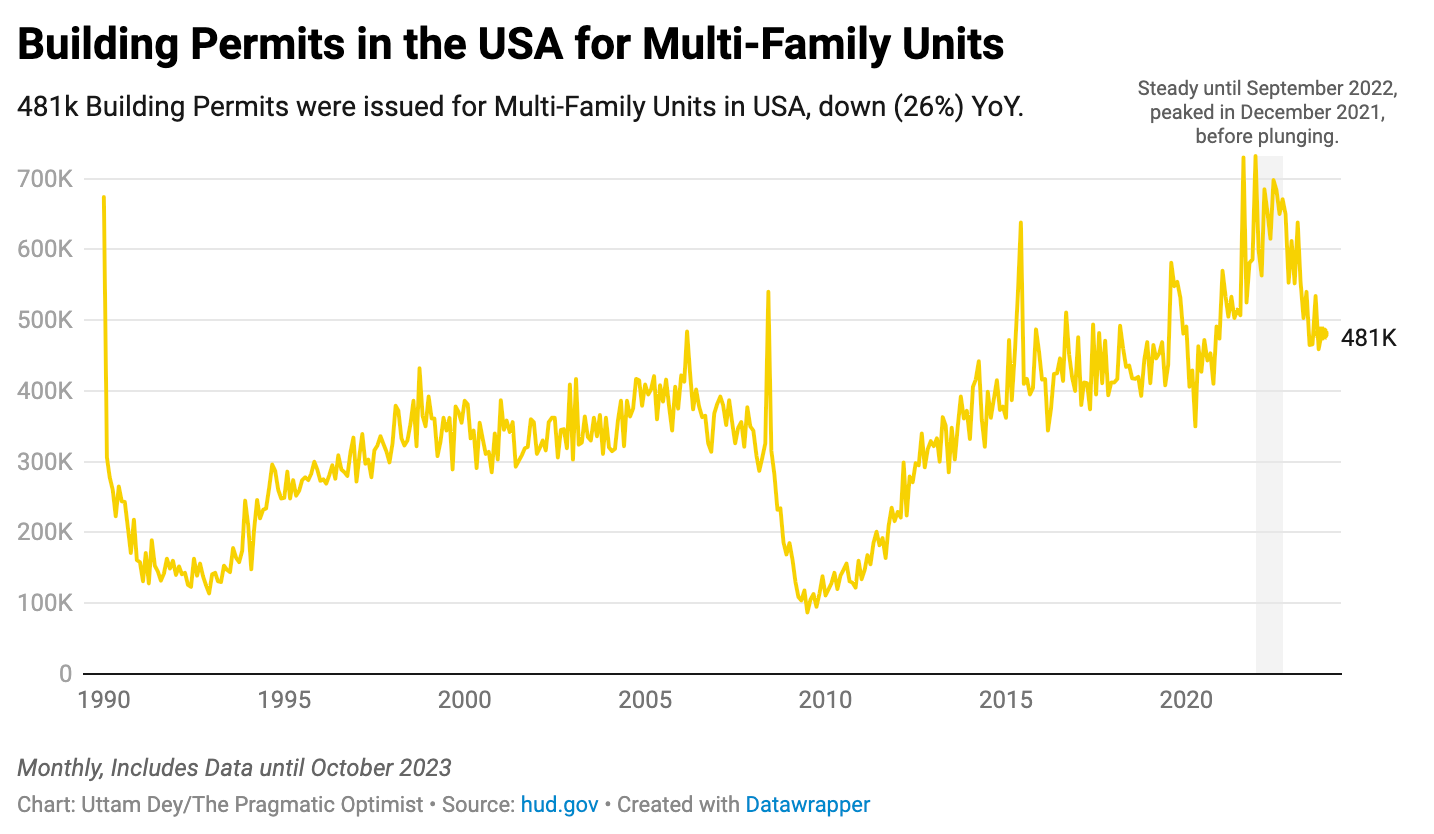
Meanwhile, building permits in the multi-family housing market peaked in December 2021 and unlike the single family permits, did not immediately fall off a cliff. The permits in the multi-family housing space stayed more or less steady until October 2022 and since then, has started declining and has not yet found a bottom.
How does this reflect in the units under construction for single and multi-family homes? While we have taken a look at units under construction as a whole earlier, now it is time to dive deeper into it.
The number of single family units under construction has improved since January 2023 and is up 13% on a YoY basis as of October 2023. This is consistent with the building permits data for single-family homes that has also climbed 14% YoY since finding its local bottom in December 2022. Since building permits lead construction activity, the overall impulse of the construction activity in the single-family housing market has been steadily improving.
On the other hand, the picture in the multi-family housing market is starting to look grim. The number of multi-family units or apartments under construction, which was holding steady until May 2023 is now precipitously dropping, down (31)% on a YoY basis. This is also consistent with the building permits data that has been falling since October 2022, with a 7 month lead time, and hasn’t yet found a bottom.
(In fact the decline in multi-family housing construction activity is so sharp that it is pulling the aggregate metric down, though the multi-family housing market is considerably smaller than the single-family housing market).
I would like to point out however that the multi-family housing market could be volatile at times and therefore permits and units under construction for the multi-family housing market are not as reliable as single-family construction. One of the reasons is that it takes a lot longer to build a multi-family building compared to a single-family building.
To summarize: In aggregate, building permits peaked in December 2021, while construction spending peaked in May 2022. While building permits and construction spending have improved since their lows, they have not reclaimed their previous highs. While we see that building permits and units under construction for single-family homes are considerably improving, since hitting its local bottom in December 2022, the construction activity looks grim for the multi-family housing market, where both building permits and units under construction are declining precipitously with no sign of a bottom just yet.
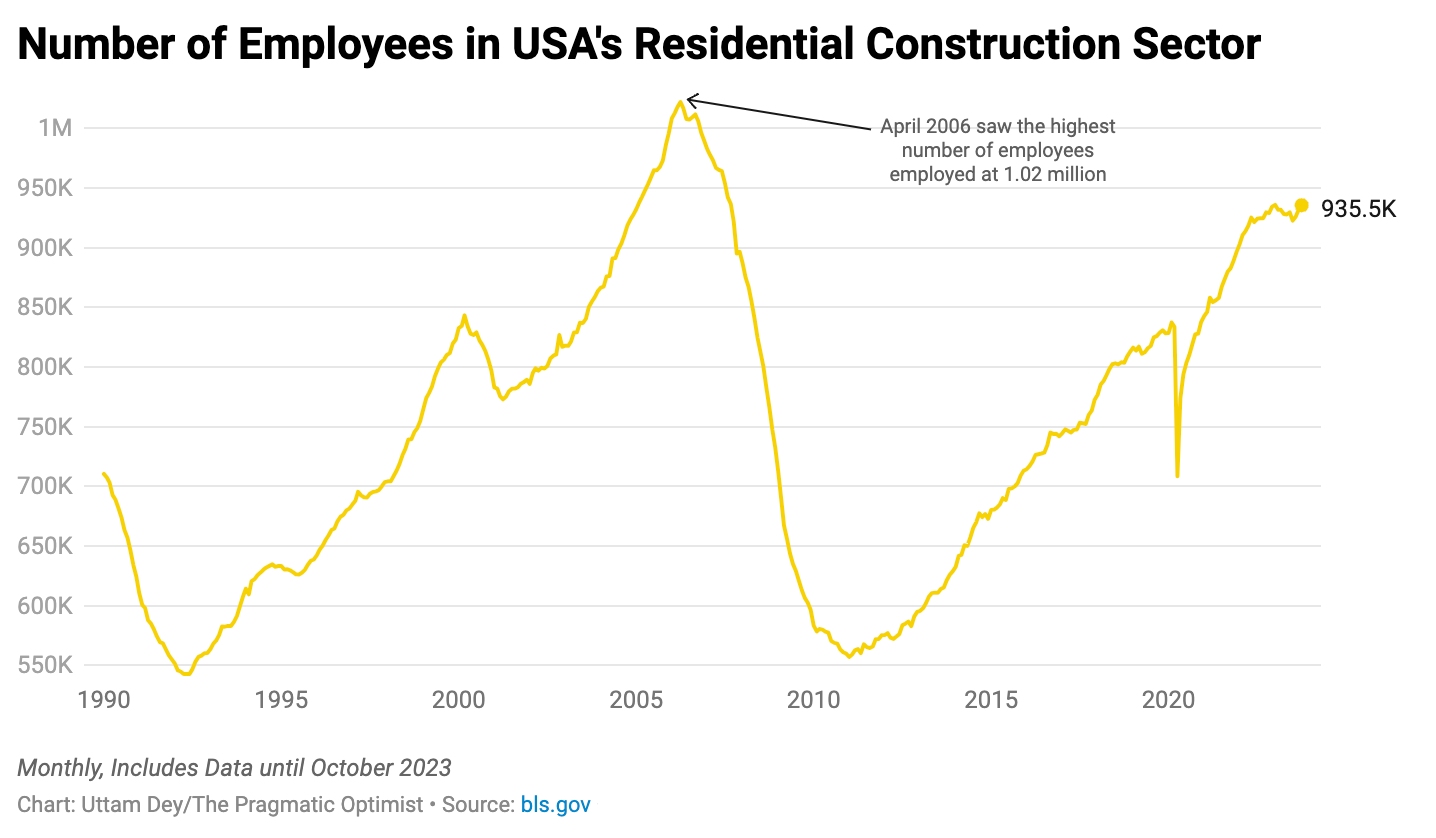
Meanwhile the state residential construction employment is strong with the number of employees in residential construction at its near-all time highs.
You would think that the decline in the housing market in 2022 would have led to a decline in residential construction employment. However that was not the case. While the single-family housing market was suffering a downturn in 2022, multi-family housing market was booming. As a result, it is possible that employees who could no longer find construction work in single-family homes in 2022, found jobs in the multi-family housing sector.
Now, this is happening in reverse. We are seeing that construction in the single-family housing market is starting to show improvement, while construction activity in the multi-family housing market is rapidly declining. Once again, it is possible that construction employees have simply shifted away from the multi-family to single-family housing market for jobs, thus holding the employment picture strong.
So, how does this all stack up?
While the construction activity in the single-family housing market is showing signs of improvement, its future direction is dependent on where mortgage rates, real Fed funds rate and overall liquidity go from here.
Since the beginning of November, we have seen 30 Y mortgage rates decline 50 b.p. to 7.22%. Meanwhile, the real 10 Y US Treasury bond yield, which peaked at 2.5% in October 2023, has also declined 50 b.p. to 2.07%. This has taken place on the back of weaker than expected economic reports on inflation, labor market and industrial production, that have calmed the volatility in the bond market.
Plus, overall liquidity in the US continues to be flat, but over the past month, has climbed higher. While the Fed’s balance sheet reduction is negative for liquidity, it is being offset by the reverse repo drawdown that is positive for liquidity. At the end of October, the Treasury released its details on how it would fund the US government for Q4, and then they surprised market participants with more short-duration T-bill issuance than expected. Issuing more T-bills allows the Treasury to draw more money out of the reverse repo facility, which puts liquidity back into the financial system. And indeed, that is what has been happening, with the reverse repo facility down to $865B. The Treasury market and the banking system may run into liquidity issues when the reverse repo is drawn all the way down, but until then, it’s generally a medium-to-positive liquidity situation.
Meanwhile, as mortgage rates have declined, mortgage applications have picked up. This could reignite demand back into the housing market as monthly mortgage payments would decline with falling mortgage rates, thus improving housing affordability. Meanwhile, given the direction of building permit and construction activity in the single family housing market, there may be more supply hitting the market in the near future, which may put some downward pressure on new home prices, given the state of demand at that time.
The one big unknown in all this is how big of a drag will the decline in multi-family housing market prove to be to the overall housing market.


2 welcome pebbles resisting a torrent. Looking forward to the 3rd pebble.
Hi Amrita- great article. Before you publish part 3 and your conclusions for the housing market, you might want to check out M3_Melody Substack (@m3melody) as she covers the residential real estate market “on the ground” beyond just published data and has warned about a lot of shadow inventory that is not in the data. Another great resource for housing is Reventure Consulting on YouTube (@ReventureConsulting) who is very data driven, but takes and combines data from a lot of different sources. Thanks for your recent notes for new Substackers :)