Bank of America says that the US economy is in "recovery" mode. Does the bond market agree?
BofA's "recovery" thesis for the US, the inverted yield curve & how shifts in the yield curve dynamics tell us whether we are headed for a soft or hard landing
At a Glance
BofA claims that the US economy is pivoting from a “downturn” phase into a gradual strengthening of the “recovery” phase.
However, the 2-10Y US Treasury yield curve is inverted, since July 2022. Today, investors are compensated 0.7% higher for investing in a 2Y US Treasury bond vs. a 10 Y US Treasury bond.
The Fed has raised rates 11 times to a target range of 5.25-5.5%, the highest level in 22 years. Such a degree of tightening has gotten investors concerned that the Fed may tip the economy into a recession.
Moreover, bank lending standards have gotten tighter. Banks are becoming more reluctant to lend to businesses and individuals because an inverted yield curve technically makes it unprofitable for banks to lend.
While BofA’s “recovery” thesis is bold and optimistic, it would require inflation to come down drastically, without creating a recession first. If BofA is right, we are headed for a “soft landing” and S&P 500 would make news highs at 5000 and above.
However, with inflation risks persisting, especially with the recent spike in oil price, it is important to understand the yield curve dynamics across scenarios where inflation do not come down from current levels or worse, goes higher.
I have built a framework that enables you to map yield curve (2-10Y) behavior to possible economic scenarios and S&P 500 target. Read below, so you can build a well-rounded perspective and drive your investment thesis with clarity.
1. BofA claims that the US economy is entering the “recovery” phase
Investors may continue to fret over an economic downturn, but Bank of America thinks otherwise.
Last week, Savita Subramanian, Bank of America's head of US equity & quantitative strategy, wrote in a recent note to clients that based on her team’s evaluation of economic data, the US economy is pivoting from a “downturn” phase into the gradual strengthening of the “recovery” phase.
2. A quick primer on the stages of the economic cycle
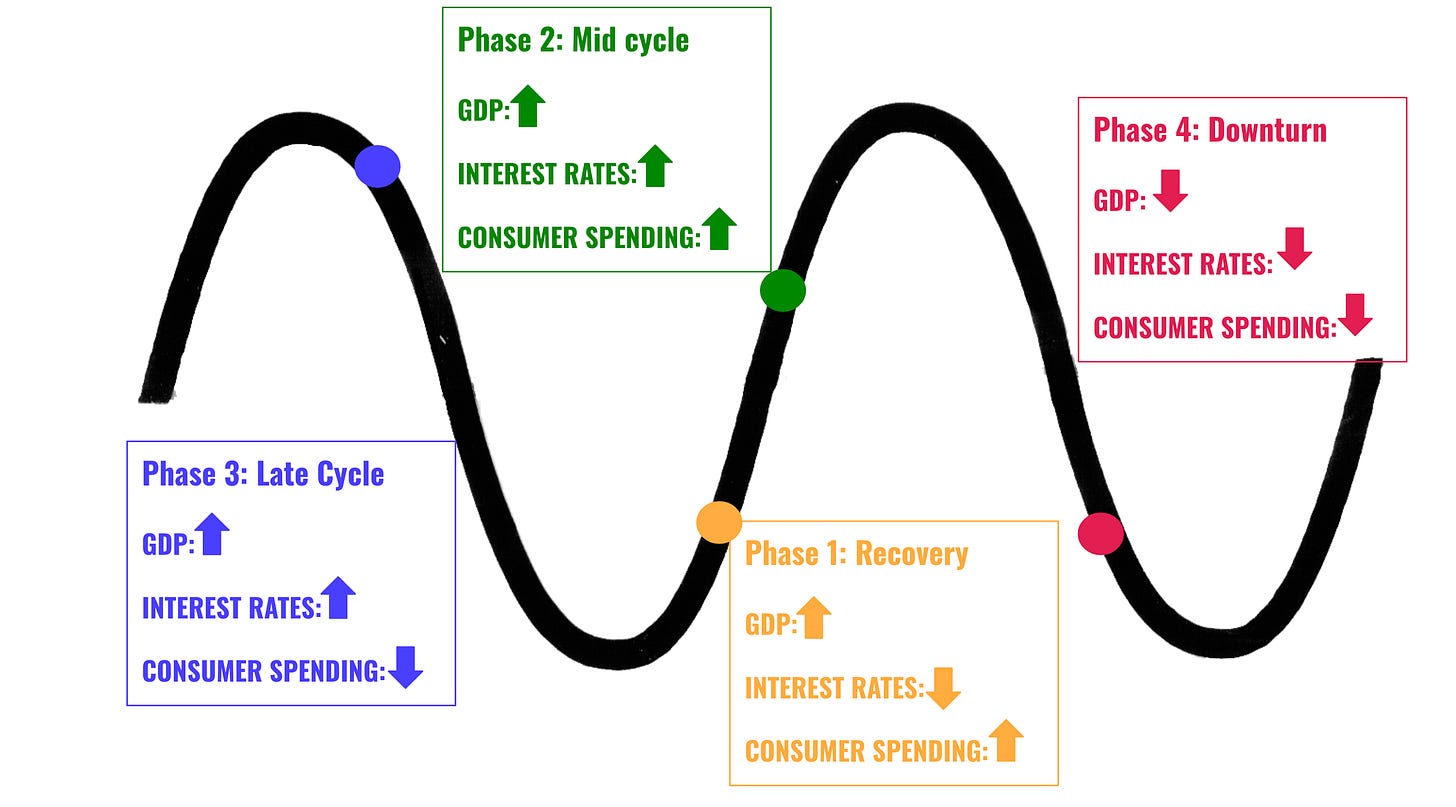
According to Investopedia, an economic cycle is the overall state of the economy as it goes through four stages in a cyclical pattern: expansion, peak, contraction, and trough.
We will overlay BofA’s terminology for the stages in the economic cycle for the purpose of simplicity and consistency.
Factors such as GDP, interest rates, total employment, and consumer spending can help determine the current stage of the economic cycle.
I have created a visual below that will help demonstrate the stages and how the economic indicators evolve through the cycle.

3. The 2-10Y US Treasury bond yield curve is inverted since July 2022
In July 2022, the yield curve for the 2Y and 10Y US Treasury bond inverted. As of the writing, the 2Y US Treasury bond yield = 5.02% and 10Y US Treasury bond yield = 4.32%. That’s a difference of -0.7%. In others words, investors are getting 0.7% higher interest rate for investing in a 2Y vs. a 10Y US Treasury bond.
This is an inverted yield curve.
A yield curve is a line that plots yields (interest rates) of bonds having the same credit quality but different maturity dates.
A normal yield curve is were longer maturity bonds have a higher yield compared to shorter term bonds. The higher interest rate on the longer maturity bonds is a reflection of the investors’ belief in
stronger growth prospects for the economy,
well-anchored inflation, and
higher term premium to compensate for interest rate risk associated with time.
In the case of an inverted yield curve, longer maturity bonds have a lower yield compared to shorter term bonds. The lower interest rates on the longer maturity bonds is a reflection of the investors’ projections for:
Poor growth or recession for the economy,
Declining inflation, and,
Lower term premium because interest rate risk is low from an impending recession.
4. The inverted yield curve disincentivizes banks to lend, thus slowing down economic growth
The 2Y-10Y Treasury bond yield curve has inverted for a reason.
Over the past year and a half, in an effort to combat rampant inflation, the central bank embarked on a series of hikes to its benchmark interest rate, which has risen from near zero to a range of 5.25% to 5.5%.
During this time, investors are becoming increasingly concerned that the Fed’s aggressive rate hike regime could slow the economy to the point that it tips into a recession.
An inverted yield curve is a bad sign for the economy because it slows down bank lending activities. Why?
Banks make money by borrowing short and lending long. That means, typically, the bank takes money you deposit at a low rate and lends it out to people and businesses who want longer-term loans.
An inverted yield curve makes the math unprofitable for banks to lend. That means they’re more reluctant to lend to businesses and consumers, which slows the economy.
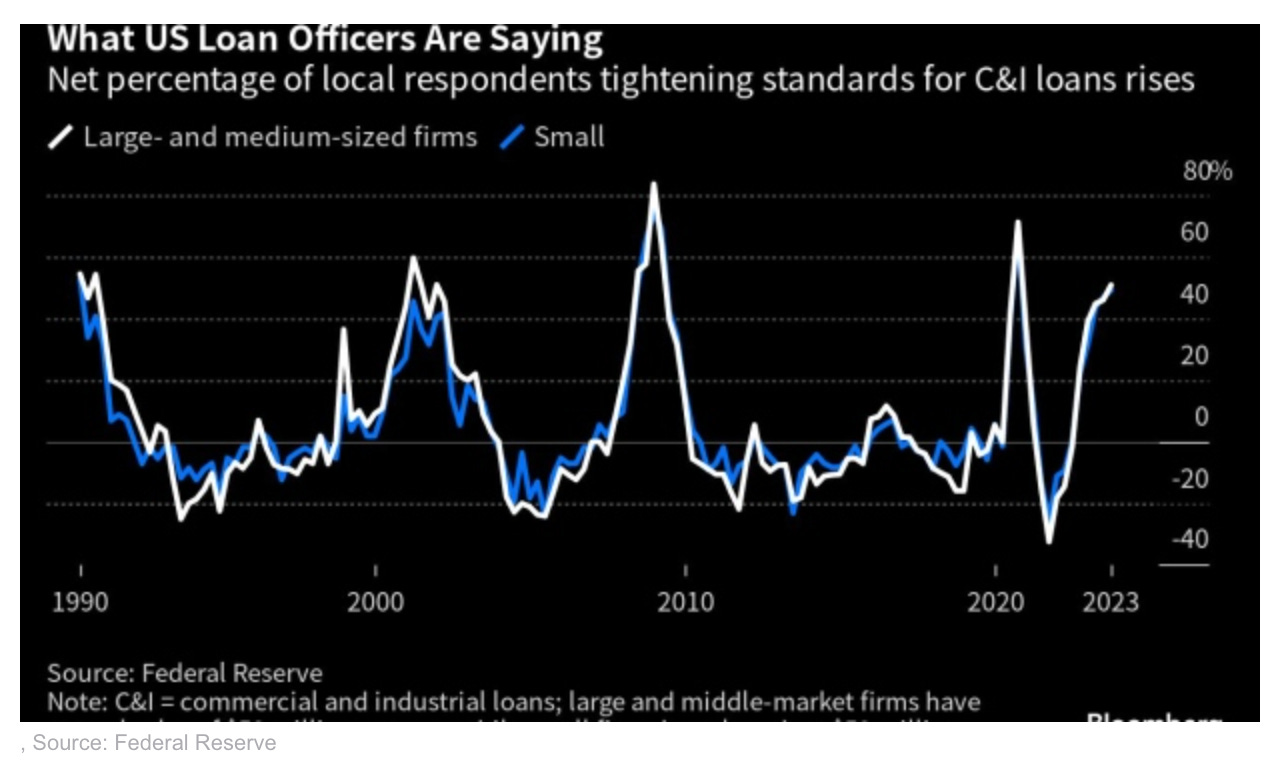
After the collapse of four regional banks in the USA earlier this year, the proportion of US banks tightening terms on commercial and industrial loans for medium and large businesses rose to 50.8% in Q3 2023, up from 46% in Q2, according to a Fed survey of lending officers.

5. Will the recession prophecy of the inverted yield curve come true again this time?
To answer the question, let’s dive into the Yield Curve dynamics, which will act as a proxy to determine which economic scenario will likely play out.
Based on that, we would know where S&P500 would ideally be which will enable you to drive your investment strategy accordingly to optimize your returns.
From the above framework/map, we can see that the ideal scenario lies in the following set of circumstances working out in the economy:
Inflation drops from current levels, which leads to the 2Y US Treasury bond yield to fall, in anticipation or reaction to the Fed cutting interest rates.
The 10Y US Treasury bond will also fall, however it will fall at a slower pace than the 2Y US Treasury bond.
This phenomenon is known as the “bull steepening”. The yield curve (2-10Y) will de-invert, where the 10Y US Treasury bond will once again have a higher yield than the 2Y US Treasury bond.
If this scenario takes place without a recession at first, this will be the ideal soft landing.
In this case, S&P500 will reach new highs 5000+. Long maturity bonds will underperform in this scenario.
I believe that BofA’s “recovery” thesis is bold and optimistic.
When I look at the framework above and assess the direction of inflation and earnings growth, I believe the “recovery” thesis is quite risky.
There is a real chance of inflation picking up once again, with the spike in oil prices. This will lead to the 2Y Treasury staying anchored or going up from here. This will result in “Higher for longer” or “Stagflation” scenario, depending on how the 10Y Treasury reacts.
In the “Higher for longer” scenario, the economy manages to grow despite higher rates.
In the “Stagflation” scenario, the economy slips into recession (negative economic growth) amidst high inflation.
If BofA’s “recovery” thesis has to work out next for the US economy, a lot of storm clouds need to clear off in order for that economic scenario to take shape.
That’s all for today, folks!!
If you enjoyed today’s post, please spread the love by sharing it with your network and helping The Pragmatic Optimist grow.
Have a great week!!!
Amrita


