The "Fed Put" is back. Will this set a new rally in stocks?
The Fed just turned dovish even though inflation is running over 2.2%. Yet, there are glaring signs that the US economy is starting to slow. Is this another policy error or a blessing in disguise?
Welcome back everyone to another edition of The Monday Macro.
««Monday Macro- The 2-minute version»»
After the two day rate-setting meeting, the Fed kept its rates unchanged at 5.25-5.5%. However, Chair Powell, who I believed to be hawkish, turned out to be quite dovish in his statements.
Why it matters: With inflation running over the Fed’s 2.2% target, I expected the Fed to continue its hawkish tone. I was wrong. Not only did the Fed rule out a rate hike, it also announced that it will taper it QT program by slowing the pace of its securities holdings from $60B to $25B a month. This is a relief for the longer-term bond yields as the US government won’t have to auction as many Treasuries in the open market. Plus, a reduction in the pace of QT implies better liquidity conditions ahead.
Say hello to the “Fed Put”: A phenomenon where the Fed always “has the markets’ back” where it proactively eases financial conditions at the first sign of economic weakness, it was very popular after the GFC era. Yet today, we are not too sure whether this is a policy error in the making or a blessing in disguise.
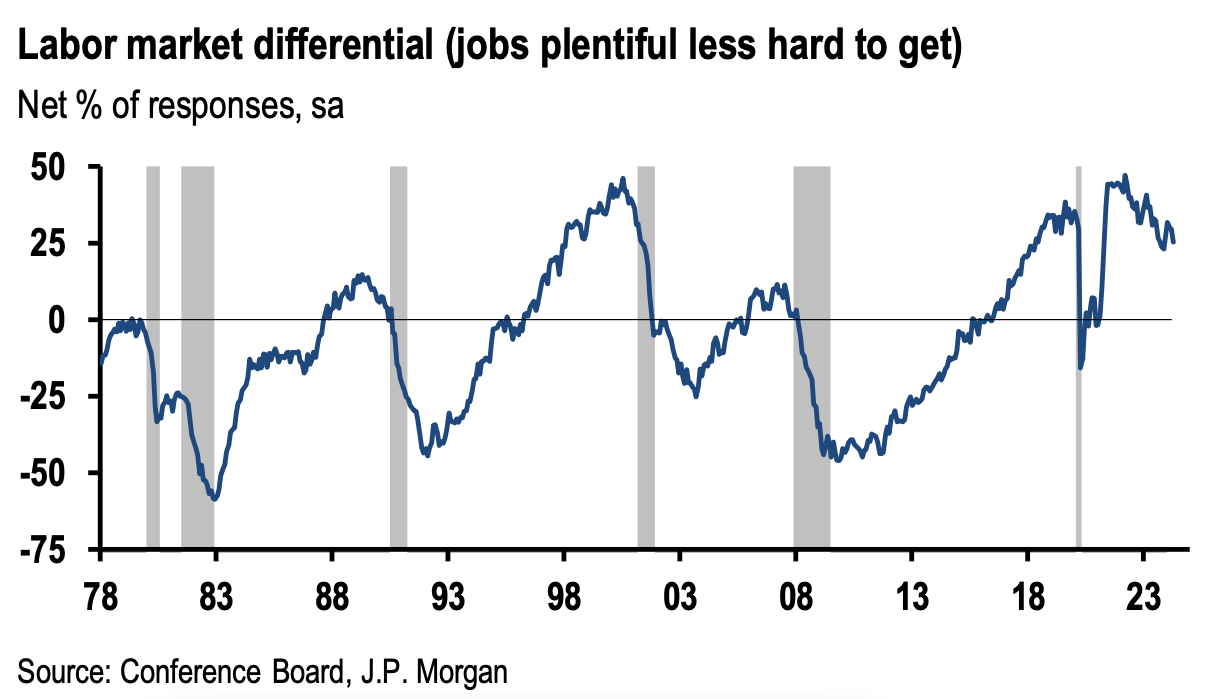
The US ain’t stagnating, but is slowing for sure: The once dreaded ratio of Job Openings to Unemployment Level has been steadily declining from its peak of 2.1 to 1.32. This has allowed wage growth to cool. A welcome sign for the Fed. Meanwhile, construction employment has taken a dive, which could spell trouble for Residential Fixed Investment in the coming quarters, leading to slower GDP growth.
Here’s what some companies have to say: Starbucks, KFC, Pizza Hut and McDonald’s have all reported shrinking same-store sales, as everyone is fighting over fewer consumers who are visiting less often. Meanwhile, e-commerce company Etsy is also struggling with declining GMV as consumers cut back on discretionary spending and choose deeper discounts instead. Even though the credit card giant Visa is still seeing strong payments volume, I believe that the perception of “stable consumer spending” could be masking the reality that many Americans are relying on credit cards to make ends meet, rather than an indication of genuine economic prosperity.
Which direction does the S&P 500 head? Short-term, hard to tell. Although I am optimistic that the US economy can still engineer a productivity acceleration, especially if the Fed Put turns out to adequately support consumer demand and the labor demand, while renewing consumer and business confidence, there is no doubt that the tapering of QT can also further incite “inflation”.
Don’t miss out this latest podcast on Seeking Alpha where and I sit at a roundtable with guest to talk about our investment portfolios and how we are positioning it for long-term success.
Say hello to “The Fed Put”. Another policy mistake or a blessing in disguise?
In my last Monday Macro post, I had discussed what the Fed will likely do next?
It’s options were:
Hike rates,
Raise the inflation target, or
Do nothing at all.
There, I argued that the safest option for the Fed would be to do nothing at all. However, I also pointed out that, given the underlying inflationary pressures from growing government deficits, it would be wise for the Fed to maintain its “hawkish” tone to help the US economy get closer to its 2% target.
Turns out, I was half correct.
After the two-day rate-setting meeting got over, the Fed indeed kept its rates unchanged at 5.25-5.5%. However, Chair Powell, who I believed would be hawkish, turned out to be quite dovish in his statements. For one, he ruled out a rate hike, which was one of the top fears that had crept into the markets lately. Instead, he spent a lot of time talking about labor market fragilities and upcoming disinflation.
On top of that, he also announced that the Fed will taper its Quantitative Tightening (QT) program by slowing the pace of decline of its securities holdings from $60B to $25B a month. A huge relief for the longer-term bond yields, as the US government won’t have to auction as many US Treasury securities in the open market since Powell just bought Yellen $35B of breathing room per month. Plus, a reduction in the pace of QT implies a slower drainage of bank reserves, or "liquidity,” from the interbank system.
Give a warm welcome to “The Fed Put”.
🤔🤔🤔In case you are wondering what a “Fed Put” is, I got you covered. It is the phenomenon where the Fed would always “have the markets’ back” by proactively easing financial conditions at the first sign of economic weakness. This was especially true during the post GFC era until 2019.
The only problem is, this time, inflation is still running higher than the Fed’s 2.2% target.
Is the “Fed Put” another policy error in the making? Or does Powell know what he is doing this time?
But first, let’s address the GDP report that sent stagflation fears down everyone’s spine.
Yes, the US GDP grew slower than expected in Q1. In fact, it slowed by more than half the pace of Q4 at 1.6%. Meanwhile, economists were projecting a growth rate of 2.2%, according to Factset.
But before we universally freak out, let’s set something straight. The GDP is an imperfect measure, with calculation quirks that can pull down or boost the figure in ways that don’t always reflect substantial shifts in the economy.
So, when we look deeper into the report, we can see that the biggest drag last quarter was a surge in imports. But wait, don’t higher imports mean strong domestic demand for goods? Precisely. Yet, imports are a subtraction in the calculation of GDP. In Q1, it subtracted 0.96 percentage points from the headline figure.
However, the indicator that ultimately set the “stagflation alarm” was the personal consumption expenditures index, which rose at 3.4% YoY, much higher than the 1.8% YoY rate in Q4 and the hottest print in a year, while the price index for gross domestic purchases, which include prices paid by US consumers, businesses and government agencies also rose at 3.1% YoY, up from 1.6% in Q4.
But before I go any further, let’s make sure we are all on the same page about what a “stagflation” is and why it is so feared.😨😨😨
Stagflation= Stagnation + Inflation. In other words, an economy is in “stagflation” when there is a persistent increase in the prices of goods and services (high inflation), along with workers who are unable to find jobs (high unemployment), which leads to declining consumer demand for goods and services (stagnant demand).
It is feared by consumers because stagflation causes reduction in purchasing power at the exact time when the economy is struggling, making it difficult to make money.
It is equally painful for the Fed as “stagflation” is atypical to their playbook, where on hand, if they lower interest rates to spur economic activity, they may incite higher inflation. Even Quantitative Easing (QE) is of no use during a stagflation, as increasing the money supply to chase limited goods and services will likely lead to even higher inflation.
Coming back to the “stagflation” scare, I don’t believe we are in one.
For one, I don’t expect to see a re-acceleration of inflation from its current levels. I am not saying we are going to return to the 2% target easily. In fact, the reduction in the pace of QT means that the Fed will be doing more work to absorb the Treasury bond issuance over the next quarters to absorb the deficit spending, especially as the Reverse Repo barrel was nearing its bottom, thus improving overall liquidity in the interbank system. And an improvement in liquidity means that private investors would rebalance their portfolios to allocate higher amounts of capital towards riskier assets such as credit or stock markets.
However, we are also at a point where the delayed effects of monetary policy are starting to surface in declining consumer confidence, weakening labor market and a possible incoming housing slowdown.
So, perhaps the Fed Put is a blessing in disguise, to balance the deflationary forces with better liquidity conditions, so as to avoid an unnecessary recession.
But first, let’s look at some of the data.
Is the floor starting to creak?
The most obvious indicator that the US economy was starting to slow (though far from stagnation) was Friday’s employment report, which showed that the US economy added 175,000 jobs in April, down significantly from 315,000 in March. Particularly notable was the shift to just 5000 jobs being added in the leisure and hospitality sector compared with 53,000 in March.
Meanwhile, job openings continued to decline down 3.7% from the previous month to 8.49M jobs, while the number of Unemployed people ticked up 1.0% from the previous month, with the Unemployment rate ticking up to 3.9%.
The once feared Job Openings to Unemployment ratio, which stood at 2.1 during its peak, is now down to 1.32, indicating better alignment of supply and demand of labor, which is reflected in cooling wage growth of 0.2% growth month-over-month. A welcome sign for the Fed.
However, consumer vibes have retreated reaching their lowest level since July 2022, as consumers have become less positive about the current labor market situation and more concerned about future business conditions, job availability and income.
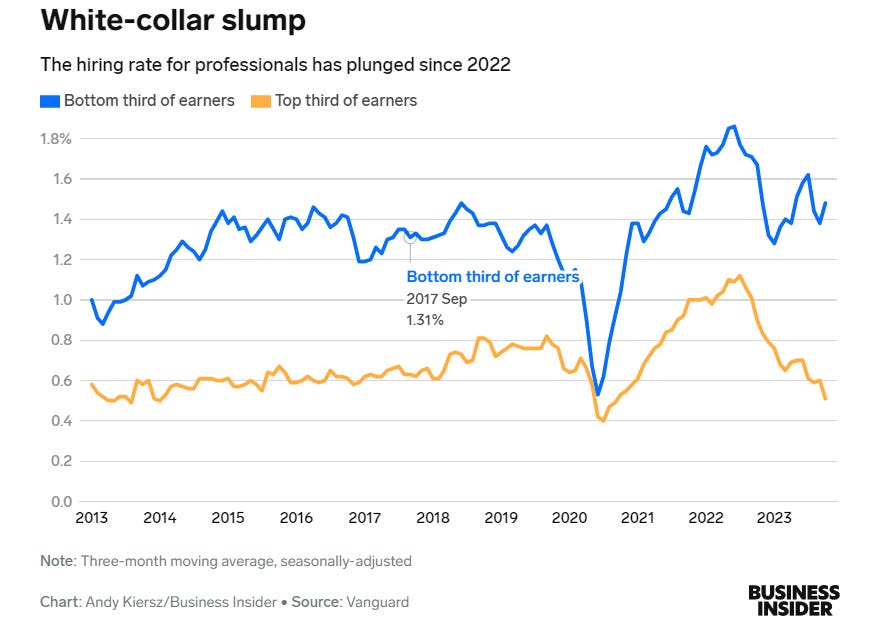
According to this post from Business Insider, “the job market is brutal right now” in white-collar hiring, where people have applied to dozens, if not hundreds of openings, only to get one or two callbacks. The dissonance also makes sense when Vanguard released its latest report on hiring, which shows that while the hiring rate for individuals who make less than $55,000 held well, it is quite depressing for individuals who make more than $96,000.
The slump in “white-collar hiring” could be related to the fewer people who are quitting right now, which would mean that companies have fewer openings they need to fill. Or it could be the result of the cutting back on corporate bloat- what Mark Zuckerberg has called “managers managing managers, managing managers, managing managers, managing the people who are doing the work."
But, it doesn’t end there.
Small businesses which are amongst the largest employers in the US are also telling us they really don't plan to actively hire a lot going forward. The chart below shows NFIB small businesses hiring plan, relative to Job Openings and it would suggest the unemployment rate should be moving gently higher from here too.
Meanwhile, Construction employment is also showing the largest downtrend, declining 39% month-over-month, and 6% annually. The erosion of both multifamily housing starts and building permits could be driving the slump. But what is even more concerning is that building permits for single family houses that had started climbing from December 2022 may be hitting its head on the wall.
Remember, building permits are the most reliable leading indicator of residential construction spending. Permits come before construction begins. The residential construction sector, often referred to as “Residential Fixed Investment” and although it makes up roughly 3-6% of the total GDP, the high multiplier nature of residential construction makes it extremely influential despite its relatively small size. So, with building permits in perpetual decline for multi-family homes and possibly peaking for single family homes, we may see a slump in residential construction spending in the coming quarters, which would weigh down on overall GDP.
Here’s some insights from the latest company earnings that further validate that the US consumers may be at a tipping point.
Recently, Starbucks SBUX 0.00%↑ announced a surprise drop in same-store sales for its latest quarter, that sent its shares down 17% post earnings. Pizza Hut and KFC also reported shrinking same-store sales. And even McDonald’s MCD 0.00%↑ said it has adopted a “street-fighting mentality” to compete for value-minded diners.
The cost of eating out at quick-service restaurants has climbed faster than that of eating at home. Prices for limited-service restaurants rose 5% YoY in March, while prices for groceries have been increasing more slowly.
“Clearly everybody’s fighting for fewer consumers or consumers that are certainly visiting less frequently, and we’ve got to make sure we’ve got that street-fighting mentality to win, regardless of the context around us,” McDonald’s CFO Ian Borden said on the company’s conference call last week.
However, there are outliers such as Wingstop WING 0.00%↑ and Chipotle CMG 0.00%↑ , which saw same-store sales grow 21.6% and 5.4% YoY respectively, even though they are more expensive than they were a year ago.
“What we’ve seen with the consumer is, if they are feeling pressure, they have a tendency to pull back on more high-frequency quick-service restaurant occasions,” Wingstop CEO Michael Skipworth said during the earnings call. He also added that the average Wingstop customer visits just once a month, using the chain’s chicken sandwich and wings as an opportunity to treat themselves rather than a routine that can easily be cut due to budget concerns.
Moving from restaurant chains to e-commerce, shares of Etsy ETSY 0.00%↑ also fell after its earnings last week after Gross Merchandise Volume (GMV) declined 3.5% YoY, with revenue growing less than 1% YoY. During the earnings call, Josh Silverman, CEO of Etsy said that the company has been “pressured by the challenging environment” of consumers pulling back spending on discretionary products such as those Etsy’s marketplace specializes in, coupled with increasing competition from Chinese companies such as Pinduoduo’s PDD 0.00%↑ discount platform Temu, Amazon AMZN 0.00%↑ and Walmart WMT 0.00%↑, who are able to offer deeper discounts in the “sea of sameness in e-commerce.”

However, when we look at credit card companies, such as Visa’s V 0.00%↑ latest earnings report, we see that payments volume is still growing strong at 8% YoY. While this may suggest strong consumer spending, a closer looking at the consumer credit debt paints a more troubling picture.
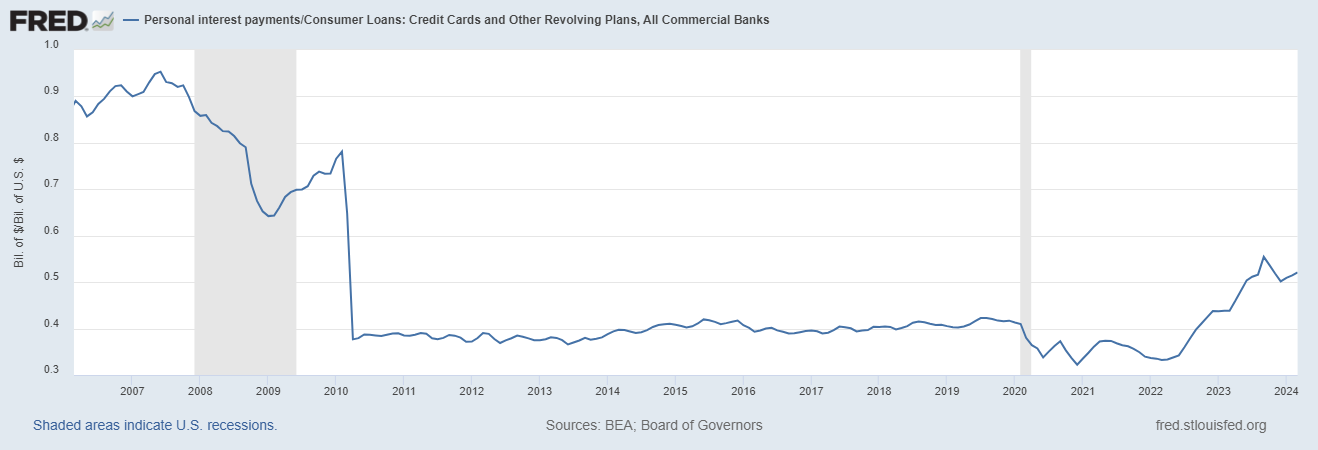
According to the latest consumer debt data from the Federal Reserve Bank of New York, Americans' total credit card balance has reached a staggering $1.129T in Q4, a level never seen before the second quarter of 2023. Therefore, I believe that the perception of “stable consumer spending” could be masking the reality that many Americans are relying on credit cards to make ends meet, at a time when interest rates on credit cards have skyrocketed and personal interest payments as a percentage of total credit card debt is steadily climbing higher, rather than an indication of genuine economic prosperity.
Tying it together: Is there any upside left for the S&P 500?
In December last year, I had said that the S&P 500 is most likely to remain range-bound in 2024 with a target of 4300-4500. Well, the first three months of the year proved to me that I was dead wrong when the index climbed to a peak of 5261. What I believe I missed in my assumption was that the S&P 500 was at freedom to price in a “soft landing” scenario for as long as earnings were not revised lower and inflation continued to fall towards its 2% target.
However, since its peak, the S&P 500 has declined 1.5% to 5180 as of today’s closing. So, where do we go from here?
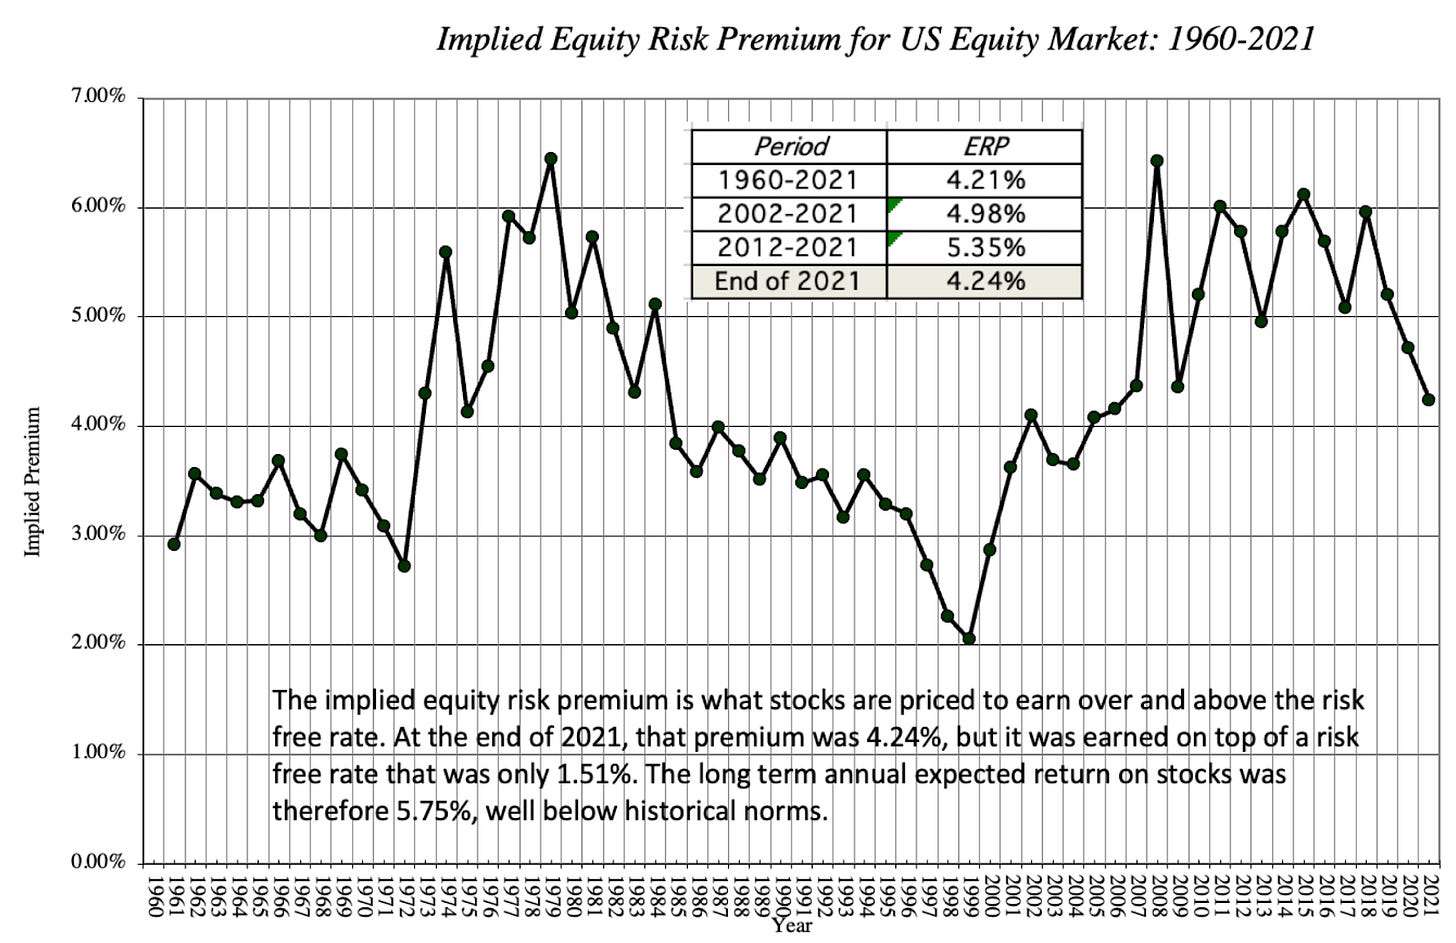
Let’s start by looking at the equity risk premium. For those of you, who are wondering what this fancy term means, it is the additional premium that an investor demands on top of a risk-free rate to invest in equities. Today, the equity risk premium stands at approximately 4.2%. This number is based on my assumption that the S&P will grow its earnings by 10.64% and 13.5% YoY in 2024 and 2025 respectively based on consensus estimates and that the yield on the 10Y US Treasury bond will remain between 3.5-4.5%.
So, is an equity risk premium of 4.2% too high or too low?
If you are familiar with
work, he has shared the following chart on his blog which illustrates the equity risk premium of the S&P 500 between 1960-2021. Turns out an equity risk premium of 4.2% is right around the average of the 196-2021 time period, though, it is lower than the average of 5.35% between 2012-2021.But, where S&P 500 heads next will be determined by the future equity premium which is a function of 1) Actual vs. Expected earnings growth, 2) Actual vs. Expected Inflation and 3) Overall Economic (un)certainty.
So, let me present you with my Macroeconomic Scenario Map, where I computed the possible range of S&P 500 targets based on my assumption for the equity risk premium in all of the following six scenarios.
Here’s my take: 👇🏼👇🏼👇🏼
While I am optimistic about the “Productivity Acceleration” scenario, especially if the Fed’s tapering of QT turns to be a boon to support consumer demand and labor market in a way, where we see a renewal of consumer and business confidence, coupled with increasing capital expenditure, I am not certain whether whether S&P 500 will take a straightforward path upwards to achieve that outcome.
At the same time, I also believe that the probability of slipping into a “deflationary recession” is not high, and the only way we can fall into a “stagflationary recession” is if there is a sudden geopolitical event that causes a spike in commodity prices, or worse major world powers enter into a war. As you can imagine, building financial models based on these rare, yet catastrophic events can be extremely difficult, so in order to save myself from a few all-nighters, I will assign “stagflationary recession” a low (but higher than “deflationary recession”) probability at the moment.
In the meantime, the tapering of the QT will provide breathing room to the US government, thus reducing the supply of US Treasuries in the market, as well as interest rates associated with them. Plus the slower drainage of reserves in the interbank system will boost overall liquidity, which tends to be positively correlated with the S&P 500. Given the “inflationary” nature of this policy, we have to remain cautious at the same time.
Curious how to boost your investment returns in these confusing times?
Check out this podcast on Seeking Alpha, where Uttam Dey, I and two other guests sat down to talk about our portfolios and how we are positioning it for long-term success. Hint: Gold, Bitcoin, Defense, Cybersecurity, Selective AI companies and T-bills are top of the list for us.
So, which camp do you belong?
Photo of the Week
Taking inspiration from
, here’s my photo of the week. The best part of building “The Pragmatic Optimist” is I can take a break in the middle of the day to go outside, take a walk and have a good old-fashioned chocolate Cornetto with my partner in crime on the beach. A rare privilege, for which I am very thankful for. Plus, the summer is an added bonus.That’s all for today, folks. Hope you found this post useful.
Please leave your thoughts in the comments section below.
Amrita 👋🏼👋🏼


I'm in the camp that we get one rate cut this year, two max, as long as we don't experience some black swan crisis. Great read, really like your Macroeconomic Scenario Map!
Why does the fed openly strive for lower wage growth? Wage growth does not cause inflation